pacman::p_load(
  dplyr,         # manipulation des données
  tidyr,         # restructuration des données
  purrr,         # itération fonctionnelle
  lubridate,     # gestion des dates
  slider,        # opérations sur fenêtre mobile pour le taux pondéré
  ggplot2,       # visualisation des données
  ggtext,        # texte markdown dans les titres ggplot
  wesanderson,   # palettes de couleurs (Zissou1)
  scales,        # formatage des axes
  forcats,       # ordre des facteurs
  stringr,       # manipulation des chaînes
  tibble,        # tableaux de données tidy
  knitr,         # rendu de tableaux html
  cli,           # messages informatifs
  here           # chemins de fichiers reproductibles
)Taux de notification des établissements de santé
Aperçu
Dans le cadre du SNT, les données de surveillance de routine alimentent chaque stratification, estimation de charge et cible d’intervention en aval, et leur fiabilité repose sur deux questions complémentaires. La page Méthodes de détection des données manquantes pose la question quelles valeurs manquent dans les données reçues. Cette page pose la question quels établissements ont effectivement transmis des données : quelle proportion des établissements de santé qui auraient dû notifier l’ont effectivement fait, à travers la géographie et le temps. Le taux de notification est l’autre face de la pièce des données manquantes.
Un taux de notification est observed / expected pour un couple établissement-mois et indicateur donné. Le nombre observé est le nombre d’établissements qui ont soumis une valeur non manquante pour l’indicateur au cours de cette période. Le nombre attendu est le nombre d’établissements qui étaient actifs et raisonnablement censés notifier, défini par le statut d’activité, le type d’établissement et l’indicateur. La page Détermination du statut actif et inactif produit le panel équilibré établissements × mois (panel_df) avec une colonne is_active que cette page consomme.
Les taux de notification alimentent deux utilisations en aval dans le SNT :
- Évaluation du système : diagnostiquer où et quand la notification de routine est incomplète afin que l’équipe puisse prioriser où renforcer la surveillance. Par exemple, identifier les districts dont la notification
conftombe en dessous de 70 % pendant la saison des pluies, ou les types d’établissements qui sous-notifient régulièrementIPTp3même quand d’autres indicateurs sont soumis. - Ajustement de la charge : estimer les cas qui auraient été notifiés si chaque établissement attendu avait notifié. Le taux de notification non pondéré est la bonne métrique pour l’évaluation du système ; la version pondérée, qui donne une influence proportionnellement plus grande aux grands établissements, est ce dont la plupart des corrections de charge ont besoin, car l’absence du décompte des cas confirmés d’un grand hôpital fausse bien davantage l’estimation du district que l’absence d’une petite clinique.
Le taux de notification est aussi le terme R qui entraîne la deuxième étape de l’ajustement d’incidence par paliers : une fois les cas ajustés pour les tests incomplets (N₁), l’étape suivante les gonfle par l’inverse du taux de notification pour récupérer les cas manquants parce que les établissements n’ont pas soumis de données, \(N_2 = N_1 / R\). Le biais que nous corrigeons ici est le biais de sous-notification : sans cette étape, les districts dont les systèmes de notification sont plus faibles paraissent en meilleure santé que les districts à forte notification même quand leur charge réelle est identique, et le ciblage des interventions SNT serait poussé vers les districts qui notifient mieux plutôt que ceux qui ont une charge plus élevée. Chaque choix fait sur cette page, notamment l’indicateur, le dénominateur et la pondération, se répercute directement sur cet ajustement.
NoteObjectifs
- Calculer les taux de notification mensuels pondérés et non pondérés pour tout indicateur de routine à tout niveau administratif
- Visualiser les tendances des taux de notification par indicateur, unité administrative et temps à l’aide de cartes thermiques et de graphiques linéaires
- Générer des sorties de taux de notification validées que les workflows de stratification et de correction de charge en aval peuvent consommer
Comprendre le taux de notification
Trois décisions façonnent chaque sortie de taux de notification : quels établissements sont comptés comme attendus, quel indicateur définit une notification, et si les établissements sont pondérés par leur charge habituelle de cas. Nous développons chacun ci-dessous avant de les implémenter dans le code.
Établir le dénominateur
Avant d’évaluer la proportion d’établissements qui ont notifié au cours d’une période donnée, nous déterminons le nombre d’établissements qui devraient notifier. Un dénominateur trop large (incluant des établissements qui n’auraient pas dû notifier pour cet indicateur) sous-estime le taux et donne une image inexacte de la qualité de la surveillance. L’équipe SNT peut, par exemple, envisager :
- Lors du calcul du taux de notification pour les cas de paludisme confirmés, exclure les types d’établissements qui ne testent pas ou ne traitent pas le paludisme, par exemple les cliniques VIH ou les maternités.
- Lors du calcul du taux de notification pour les admissions pour paludisme, exclure les types d’établissements qui ne gèrent que les patients ambulatoires, par exemple les agents de santé communautaires ou les postes de santé.
- Lors du calcul du taux de notification pour un indicateur, exclure les établissements qui ont fermé, qui ne sont pas encore actifs, ou qui sont temporairement non fonctionnels. Cela évite de pénaliser les établissements nouvellement ouverts qui n’étaient pas censés notifier dans les mois précédents, ou les établissements définitivement ou temporairement fermés et donc non tenus de notifier.
Les listes maîtresses d’établissements (MFL) à jour qui suivent le type et le statut d’activité des établissements sont utiles pour déterminer quels établissements de santé doivent être inclus dans le dénominateur du taux de notification de chaque indicateur, pour chaque période de notification. En l’absence d’une MFL ou d’une détermination officielle du statut d’activité, le statut d’activité peut toujours être inféré à partir des données de notification elles-mêmes ; la page Détermination du statut actif et inactif couvre les trois méthodes (Méthode 1 : Permanente, Méthode 2 : Premier au dernier, Méthode 3 : Longueur de séquence dynamique) et produit le panel équilibré (panel_df) avec l’indicateur is_active que nous consommons ici.
ImportantConsultez l’équipe SNT
Consultez l’équipe SNT sur les types d’établissements qui, le cas échéant, doivent être exclus du dénominateur pour chaque indicateur. Les pratiques nationales varient et le responsable de la surveillance au sein de l’équipe SNT peut expliquer ce qui est approprié pour chaque indicateur dans le contexte du pays.
Ce à quoi ressemble une notification incomplète
Avant de calculer le taux de notification, il est utile de distinguer deux façons distinctes pour un établissement de ne pas notifier, dont une seule est visible dans les données :
- Type A : soumis mais partiel. L’établissement soumet le formulaire mensuel mais avec seulement un sous-ensemble des cas observés ce mois-là. Le formulaire est non manquant, donc un calcul de taux de notification compte l’établissement comme « notifiant », mais les cas à l’intérieur sont sous-comptés. Ce mode d’échec est invisible pour les données seules et ne peut être détecté que par des audits de qualité des données (DQA) ou en triangulant avec des indicateurs connexes (par exemple, des cas confirmés bien inférieurs aux cas testés).
- Type B : n’a pas soumis. L’établissement n’a soumis aucune valeur pour l’indicateur ce mois-là, donc le champ est
NA. Ce mode d’échec est ce que mesure la métrique du taux de notification : le dénominateur compte l’établissement comme attendu, le numérateur ne le compte pas comme observé.
Tout ce qui suit, notamment observed / expected, pondéré vs non pondéré, les cartes thermiques et les graphiques linéaires, traite le Type B. Un taux de notification élevé n’exclut pas une sous-notification de Type A, et un taux de notification faible coexiste souvent avec le Type A dans les mois qui ont été soumis. Les deux types sont importants pour l’ajustement de la charge en aval ; l’un est résolu ici, l’autre remonte vers les workflows DQA.
Calcul du taux de notification
Le taux de notification est calculé par indicateur, et non sur l’ensemble des indicateurs. Les pratiques de notification varient selon les indicateurs au sein d’un même établissement. Par exemple, un établissement peut prioriser la notification des cas confirmés (parce que le réapprovisionnement en stocks dépend d’une notification cohérente) mais négliger les consultations ambulatoires toutes causes confondues. Lorsqu’un taux de notification agrégé est requis (un établissement compté comme notifiant seulement s’il notifie plusieurs indicateurs ensemble), il est borné par le minimum des taux par indicateur, car un établissement qui manque l’un quelconque des indicateurs est exclu du numérateur tout en restant dans le dénominateur pour tous.
Pour chaque indicateur d’intérêt, le taux de notification est défini comme :
\[ \text{Indicator Reporting Rate}_{a,t} = \frac{o_{a,t}}{e_{a,t}} \]
Où :
- \(a\) est l’unité administrative (par exemple, chefferie ou district)
- \(t\) est la période (par exemple, « 2022-03 »)
- \(o_{a,t}\) est le nombre d’établissements observés dans l’unité \(a\) durant la période \(t\)
- \(e_{a,t}\) est le nombre d’établissements attendus dans l’unité \(a\) durant la période \(t\)
Exemple illustratif
Supposons que nous calculions le taux de notification pour le total des cas confirmés pour Kailahun (adm2 = "KAILAHUN") en mars 2022.
- Il y a 89 établissements de santé à Kailahun qui ont déjà soumis des données sur tout indicateur clé du paludisme
- Les 89 ont soumis leur premier rapport au plus tard en mars 2022, donc ils sont supposés actifs et censés notifier ce mois-là
- Parmi eux, 80 établissements ont notifié une valeur valide pour
conf(cas confirmés totaux) en mars 2022 → 80 sont observés notifiant - Les 9 autres n’ont pas de valeur valide pour le total des cas confirmés (ils affichent
NAdans la base de données) pour mars 2022
Le taux de notification est calculé comme suit :
\[ \text{Reporting Rate for Total Confirmed Cases}_{\text{Kailahun},\text{Mar 2022}} = \frac{80}{89} = 0.899 \]
Taux de notification pondérés et non pondérés
Le taux de notification non pondéré traite chaque établissement de façon égale. Le taux de notification pondéré donne aux grands établissements une influence proportionnellement plus grande, estimant ainsi la proportion de la charge de cas habituelle d’un indicateur qui a été notifiée dans la surveillance de routine, plutôt que la proportion d’établissements qui ont notifié.
Les deux métriques peuvent évoluer en sens opposés pour le même district :
- Si un établissement non notifiant est généralement un petit contributeur à la charge du district, le taux de notification pondéré est plus élevé que le non pondéré (moins de cas manquent que le nombre d’établissements ne le suggère).
- Si un établissement non notifiant est généralement un grand contributeur, le taux de notification pondéré est plus bas que le non pondéré (plus de cas manquent que le nombre d’établissements ne le suggère).
Pourquoi le taux non pondéré ne suffit pas
Considérons un seul district en 2022 avec trois établissements notifiant les cas confirmés : un hôpital de référence (charge élevée) et deux centres de santé périphériques HF1 et HF2 (faible charge). Une coche (✓) signifie que l’établissement a notifié ce mois-là ; un tiret (–) signifie qu’il ne l’a pas fait.
| Month | 1 | 2 | 3 | 4 | 5 | 6 | 7 | 8 | 9 | 10 | 11 | 12 |
|---|---|---|---|---|---|---|---|---|---|---|---|---|
| Hôpital | ✓ | ✓ | – | ✓ | ✓ | ✓ | – | ✓ | – | ✓ | ✓ | ✓ |
| HF1 | ✓ | ✓ | ✓ | ✓ | – | ✓ | – | – | ✓ | ✓ | ✓ | ✓ |
| HF2 | – | ✓ | ✓ | – | ✓ | ✓ | ✓ | ✓ | – | – | ✓ | ✓ |
| Notifiés | 2 | 3 | 2 | 2 | 2 | 3 | 1 | 2 | 1 | 2 | 3 | 3 |
| Attendus | 3 | 3 | 3 | 3 | 3 | 3 | 3 | 3 | 3 | 3 | 3 | 3 |
| Taux non pondéré | 66% | 100% | 66% | 66% | 66% | 100% | 33% | 66% | 33% | 66% | 100% | 100% |
Le taux non pondéré affiche le même 66 % pour les mois 1, 3, 4, 5, 8 et 10. Au mois 3, l’établissement manquant est l’hôpital ; au mois 5, c’est un centre de santé périphérique HF1. Ces deux mois ne sont pas équivalents. Le mois où l’hôpital manque perd bien plus de cas que le mois où HF1 manque, même si les deux affichent 66 %. Le taux pondéré attribuerait à l’hôpital un poids bien plus élevé, ramènerait le mois 3 près de la part des cas du district de l’hôpital (peut-être 20–30 %), et laisserait le mois 5 proche de 90 %+. Les calculs standard de taux de notification supposent le même poids par enregistrement notifié ou manqué, ce qui est incorrect chaque fois que les charges de cas des établissements diffèrent, c’est-à-dire presque toujours.
Calcul du taux de notification pondéré
Pour chaque couple établissement-mois, le poids de l’établissement est sa valeur moyenne d’un proxy de taille choisi (typiquement test ou allout) sur les 12 mois précédents, divisée par la somme de ces moyennes mobiles pour tous les établissements de la même unité administrative et du même mois. Par défaut, la période en cours est exclue de sa propre fenêtre, de sorte que le poids d’un établissement au mois t est déterminé par ce qu’il faisait aux mois t-12 … t-1. Les mois durant lesquels un établissement était inactif contribuent zéro à cette moyenne, de sorte que les établissements chroniquement inactifs portent de faibles poids. Le taux de notification pondéré du district pour un mois-année donné est alors la somme des poids des établissements qui ont soumis une valeur non manquante ce mois-là.
D’autres stratégies de pondération existent (par exemple, une moyenne par mois calendaire sur toutes les années de données) ; la section Étape par étape implémente la fenêtre mobile de 12 mois excluant la période en cours et signale les alternatives là où elles s’appliquent.
Quand utiliser laquelle
| Cas d'usage | Métrique | Pourquoi |
|---|---|---|
| Diagnostiquer la performance du système de surveillance | Non pondéré | Chaque établissement compte de façon égale, donc un taux de 70 % signifie que 70 % des établissements ont notifié. |
| Estimer les cas non notifiés pour la correction de la charge | Pondéré | Tient compte du fait qu'un grand hôpital manquant représente bien plus de charge de cas qu'une petite clinique manquante. |
Lorsque nous utilisons la version pondérée pour l’analyse en aval, nous calculons aussi la version non pondérée et les comparons ; la comparaison elle-même révèle si les plus grands contributeurs notifient de façon cohérente.
Hypothèses sous-jacentes à tout ajustement du taux de notification
Chaque fois qu’un taux de notification est utilisé pour gonfler les cas notifiés en tant que R dans \(N_2 = N_1 / R\), trois hypothèses l’accompagnent. Ce ne sont pas des défauts de la métrique ; ce sont les simplifications structurelles qui rendent l’ajustement réalisable. Les énoncer en amont facilite le jugement sur quand l’estimation ajustée est fiable et quand elle ne l’est pas.
WarningTrois hypothèses à garder à l’esprit
- Les non-notifiants ressemblent aux notifiants. Les cas gonflés à partir de
cases_reported / Rsupposent que les couples établissement-mois manquants suivent la même distribution de cas que ceux qui notifient. Si les établissements deviennent silencieux précisément lors d’épidémies, de ruptures de stock ou de pénuries de personnel (exactement quand leur charge de cas est inhabituelle), cette hypothèse s’effondre et l’ajustement est biaisé. - Les taux de notification annuels manquent les variations saisonnières. La complétude de la notification varie au cours de l’année : les saisons des pluies, les mois de vacances et les périodes de rupture de stock freinent toutes les soumissions. Calculer et appliquer toujours les taux de notification mensuellement, et non annuellement, surtout dans les contextes de transmission saisonnière.
- Les taux au niveau du district masquent quels établissements sont silencieux. Un district à 70 % pourrait manquer chaque petite clinique de façon égale, ou manquer systématiquement son hôpital de référence mois après mois. Les deux ont des implications très différentes pour la charge. Inspecter la notification au niveau des établissements parallèlement au taux du district, et utiliser la version pondérée pour faire émerger les lacunes liées aux hôpitaux.
Étape par étape
Nous décrivons ici les étapes pour calculer et visualiser les taux de notification mensuels à partir de données DHIS2 illustratives provenant de la Sierra Leone. Les données de routine nettoyées proviennent de la page prétraitement DHIS2 ; le dénominateur des établissements actifs provient de la page statut actif.
Étape 1 : Charger les paquets et les données
Étape 1.1 : Charger les paquets R requis
Pour adapter le code :
- Ne rien modifier dans le code ci-dessus.
from pathlib import Path

import geopandas as gpd
import matplotlib.colors as mcolors
import matplotlib.pyplot as plt
import matplotlib.ticker as mticker
import numpy as np
import pandas as pd
import pyreadr
from pyprojroot import here

# ── fonctions d'aide cli ──────────────────────────────────────────────────────
def cli_header(message):
    print(f"\n{message}")

def cli_info(message):
    print(f"INFO: {message}")

def cli_success(message):
    print(f"SUCCESS: {message}")

def cli_warning(message):
    print(f"WARNING: {message}")

def cli_danger(message):
    print(f"ERROR: {message}")

def anti_join(left, right, on):
    """Retourne les lignes de left sans correspondance dans right."""
    right_keys = right[on].drop_duplicates()
    return (
        left.merge(right_keys, on=on, how="left", indicator=True)
        .loc[lambda x: x["_merge"] == "left_only"]
        .drop(columns="_merge")
    )

# ── aide pour les tableaux html (miroir de R show_table) ─────────────────────
def show_table(df, n=10, caption=None, digits=2):
    """Affiche les n premières lignes en HTML défilant avec le style .out-table."""
    subset = df.head(n).copy()
    for col in subset.select_dtypes(include="number").columns:
        subset[col] = subset[col].round(digits)
    html = subset.to_html(
        index=False,
        border=0,
        classes="out-table",
        na_rep="",
    )
    if caption:
        html = f"<caption>{caption}</caption>" + html
    print(f'<div class="out-scroll">{html}</div>')
Pour adapter le code :
- Ne rien modifier dans le code ci-dessus.
Étape 1.2 : Importer les données de routine prétraitées
Charger les données de routine prétraitées exportées par l’étape d’importation (clean_malaria_routine_data_final.parquet) et dériver une colonne année-mois (yearmon) par laquelle nous allons regrouper tout au long de la page.
Pour adapter le code :
- Lignes 2–6 : Ajuster les composantes du chemin si les données sont stockées ailleurs.
from pathlib import Path
import pandas as pd
from pyprojroot import here
dhis2_df = pd.read_parquet(Path(here(
"01_data/1.2_epidemiology"
"/1.2a_routine_surveillance/processed"
"/clean_malaria_routine_data_final.parquet"
)))
dhis2_df = dhis2_df.assign(
date=lambda d: pd.to_datetime(d["date"], errors="coerce"),
yearmon=lambda d: d["date"].dt.strftime("%Y-%m"),
)Pour adapter le code :
- Lignes 6–10 : Ajuster les composantes du chemin si les données sont stockées ailleurs.
Étape 1.3 : Construire le panel des établissements actifs en ligne
Le nombre attendu auquel nous comparons les notifications observées est le nombre d’établissements qui étaient actifs dans chaque combinaison mois-unité administrative. La page statut actif couvre en détail les trois méthodes de classification de l’activité ; ici nous réappliquons la Méthode 2 (premier au dernier avec une période de grâce de 6 mois) en ligne afin que cette page s’exécute de façon autonome, sans dépendre du fait que la page de statut actif ait été rendue au préalable.
Le bloc produit deux choses : panel_df, le panel équilibré établissements × mois portant une colonne is_active, qui est l’entrée que compute_rep_rate() (Étape 2) et compute_rep_rate_weighted() (Étape 4.1) consomment, et df_expected, un résumé par yearmon × adm des dénombrements d’établissements actifs, affiché pour référence afin de pouvoir vérifier ponctuellement les dénominateurs qui alimentent le taux non pondéré.
ImportantConsultez l’équipe SNT
Le dénominateur utilisé ici doit être validé par l’équipe SNT. L’ensemble des indicateurs utilisés pour définir le statut actif, et si le dénominateur doit être filtré pour des types d’établissements spécifiques, varient selon le pays et l’indicateur.
Afficher le code
# paramètres de la méthode 2 : indicateurs signalant la prestation de
# services et la période de grâce (mois) après le dernier rapport d'un
# établissement avant qu'il soit considéré comme inactif
key_indicators <- c("allout", "test", "pres", "conf", "maltreat", "maladm")
nonreport_window <- 6L
# panel équilibré établissements × mois : tout couple manquant est un
# mois sans notification
month_seq <- seq(min(dhis2_df$date), max(dhis2_df$date), by = "month")
panel <- tidyr::expand_grid(
hf_uid = unique(dhis2_df$hf_uid),
date = month_seq
)
panel_df <- dhis2_df |>
dplyr::right_join(panel, by = c("hf_uid", "date")) |>
dplyr::arrange(hf_uid, date) |>
dplyr::group_by(hf_uid) |>
tidyr::fill(adm0, adm1, adm2, adm3, .direction = "downup") |>
dplyr::ungroup() |>
dplyr::mutate(
yearmon = format(date, "%Y-%m"),
reported_any = dplyr::if_any(
dplyr::all_of(key_indicators),
~ !is.na(.x)
)
)
# dates de première / dernière notification et dernière date du panel par établissement
panel_df <- panel_df |>
dplyr::arrange(hf_uid, date) |>
dplyr::group_by(hf_uid) |>
dplyr::mutate(
first_rep = if (any(reported_any)) min(date[reported_any]) else as.Date(NA),
last_rep = if (any(reported_any)) max(date[reported_any]) else as.Date(NA),
last_date = max(date)
) |>
dplyr::ungroup()
# méthode 2 : actif à partir du premier rapport ; inactif seulement après
# expiration de la période de grâce suivant le dernier rapport
panel_df <- panel_df |>
dplyr::mutate(
months_since_last = dplyr::if_else(
is.na(last_rep),
Inf,
as.numeric(
lubridate::interval(last_rep, last_date) / lubridate::dmonths(1)
)
),
is_active = dplyr::case_when(
is.na(first_rep) ~ FALSE,
date < first_rep ~ FALSE,
date <= last_rep ~ TRUE,
months_since_last < nonreport_window ~ TRUE,
TRUE ~ FALSE
)
)
# agrégation par yearmon × unité administrative
df_expected <- panel_df |>
dplyr::group_by(yearmon, adm0, adm1, adm2, adm3) |>
dplyr::summarise(
denominator = sum(is_active, na.rm = TRUE),
.groups = "drop"
) |>
dplyr::arrange(yearmon, adm0, adm1, adm2, adm3)Pour adapter le code :
- Ligne 4 : Remplacer
key_indicatorspar les colonnes que le programme traite comme indicateurs de notification. - Ligne 5 : Ajuster
nonreport_windowpour correspondre à la période de grâce préférée du pays (mois). - Pour utiliser une méthode d’activité différente, remplacer le bloc Méthode 2 (le
case_whendéfinissantis_active) par la logique Méthode 1 ou Méthode 3 de la page de statut actif.
Afficher le code
import numpy as np
import pandas as pd
# paramètres de la méthode 2
key_indicators = ["allout", "test", "pres", "conf", "maltreat", "maladm"]
nonreport_window = 6
# panel équilibré établissements × mois
month_seq = pd.date_range(dhis2_df["date"].min(), dhis2_df["date"].max(), freq="MS")
panel = pd.MultiIndex.from_product(
[dhis2_df["hf_uid"].unique(), month_seq],
names=["hf_uid", "date"]
).to_frame(index=False)
panel_df = (
panel.merge(dhis2_df, on=["hf_uid", "date"], how="left")
.sort_values(["hf_uid", "date"])
)
# propagation avant puis arrière des métadonnées admin par groupe d'établissement
meta_cols = ["adm0", "adm1", "adm2", "adm3"]
panel_df[meta_cols] = (
panel_df.groupby("hf_uid")[meta_cols]
.transform(lambda s: s.ffill().bfill())
)
# ajouter les colonnes d'indicateurs clés manquantes pour que le prédicat soit cohérent
for _col in key_indicators:
if _col not in panel_df.columns:
panel_df[_col] = np.nan
panel_df = panel_df.assign(
yearmon=lambda d: d["date"].dt.strftime("%Y-%m"),
reported_any=lambda d: d[key_indicators].notna().any(axis=1),
)
# dates de première / dernière notification et dernière date du panel par établissement
def _facility_dates(g):
g = g.copy()
mask = g["reported_any"]
if mask.any():
g["first_rep"] = g.loc[mask, "date"].min()
g["last_rep"] = g.loc[mask, "date"].max()
else:
g["first_rep"] = pd.NaT
g["last_rep"] = pd.NaT
g["last_date"] = g["date"].max()
return g
panel_df = (
panel_df.sort_values(["hf_uid", "date"])
.groupby("hf_uid", group_keys=False)
.apply(_facility_dates)
.reset_index(drop=True)
)
# mois_depuis_dernier par établissement (correspond à lubridate::dmonths(1) = 30,4375 jours)
def _months_since(g):
g = g.copy()
if g["last_rep"].isna().all():
g["months_since_last"] = np.inf
else:
last_rep = g["last_rep"].iloc[0]
last_date = g["last_date"].iloc[0]
g["months_since_last"] = (last_date - last_rep).days / 30.4375
return g
panel_df = (
panel_df.groupby("hf_uid", group_keys=False)
.apply(_months_since)
.reset_index(drop=True)
)
# méthode 2 : actif dès le premier rapport ; inactif seulement après expiration de la période de grâce
panel_df["is_active"] = np.select(
[
panel_df["first_rep"].isna(),
panel_df["date"] < panel_df["first_rep"],
panel_df["date"] <= panel_df["last_rep"],
(panel_df["date"] > panel_df["last_rep"])
& (panel_df["months_since_last"] < nonreport_window),
],
[0, 0, 1, 1],
default=0,
).astype(bool)
# dénombrements d'établissements attendus par yearmon × unité admin
df_expected = (
panel_df
.groupby(["yearmon", "adm0", "adm1", "adm2", "adm3"], as_index=False)
.agg(denominator=("is_active", "sum"))
.sort_values(["yearmon", "adm0", "adm1", "adm2", "adm3"])
.reset_index(drop=True)
)Pour adapter le code :
- Ligne 5 : Remplacer
key_indicatorspar les colonnes que le programme traite comme indicateurs de notification. - Ligne 6 : Ajuster
nonreport_windowpour correspondre à la période de grâce préférée du pays (mois). - Pour utiliser une méthode d’activité différente, remplacer le bloc
np.selectqui définitis_activepar la logique Méthode 1 ou Méthode 3 de la page de statut actif.
Étape 2 : Définir la fonction du taux de notification
Nous définissons une fonction qui calcule le taux de notification mensuel pour tout indicateur à tout niveau d’unité administrative. Elle filtre le panel équilibré sur les couples établissement-mois actifs (is_active), puis par groupe yearmon × adm compte les établissements distincts qui ont notifié une valeur non NA pour l’indicateur (le numérateur) et les établissements distincts qui étaient censés notifier (le dénominateur). Les colonnes de sortie sont :
rep: nombre d’établissements distincts ayant notifié une valeur nonNApour l’indicateur dans ce groupe mois-unité admin (le numérateur)exp: nombre d’établissements distincts qui étaient actifs et donc censés notifier dans ce groupe mois-unité admin (le dénominateur)reprate:rep / exp, le taux de notification non pondérémissrate:1 − reprate, le complément de données manquantes
Afficher le code
compute_rep_rate <- function(panel_df, level, indicator) {
level_col <- paste0("adm", level)
group_vars <- c("yearmon", level_col)
# filtre actif : garder seulement les couples établissement-mois où
# l'établissement était censé notifier (is_active). c'est ce qui fait que
# `exp` est le décompte des établissements actifs, pas tous ceux dans l'export.
panel_df |>
dplyr::filter(is_active) |>
dplyr::mutate(
reported_any_var = !is.na(.data[[indicator]])
) |>
dplyr::group_by(dplyr::across(dplyr::all_of(group_vars))) |>
dplyr::summarise(
# compter les établissements distincts, pas les lignes, au cas où le
# panel contiendrait des doublons de couples établissement-mois.
rep = dplyr::n_distinct(hf_uid[reported_any_var]),
exp = dplyr::n_distinct(hf_uid),
.groups = "drop"
) |>
dplyr::mutate(
reprate = dplyr::if_else(exp > 0, rep / exp, NA_real_),
missrate = dplyr::if_else(!is.na(reprate), 1 - reprate, NA_real_),
indicator = indicator
) |>
dplyr::select(
dplyr::all_of(group_vars),
indicator,
rep, exp, reprate, missrate
)
}Pour adapter le code :
- Ne rien modifier dans le code ci-dessus.
Afficher le code
def compute_rep_rate(panel_df, level, indicator):
"""
Calcule le taux de notification mensuel non pondéré pour un indicateur à
un niveau admin. Miroir colonne par colonne de R compute_rep_rate().
Retourne un DataFrame avec les colonnes :
yearmon, adm<level>, indicator, rep, exp, reprate, missrate
"""
level_col = f"adm{level}"
group_vars = ["yearmon", level_col]
active = panel_df.loc[panel_df["is_active"]].copy()
active["reported_any_var"] = active[indicator].notna()
# n_distinct(hf_uid ayant notifié) et n_distinct(hf_uid total)
def _agg(g):
rep = g.loc[g["reported_any_var"], "hf_uid"].nunique()
exp = g["hf_uid"].nunique()
return pd.Series({"rep": rep, "exp": exp})
result = (
active
.groupby(group_vars, as_index=False)
.apply(_agg, include_groups=False)
.reset_index(drop=True)
)
result = result.assign(
reprate=lambda d: np.where(
d["exp"] > 0, d["rep"] / d["exp"], np.nan
),
missrate=lambda d: np.where(
d["reprate"].notna(), 1 - d["reprate"], np.nan
),
indicator=indicator,
)
col_order = group_vars + ["indicator", "rep", "exp", "reprate", "missrate"]
return result[col_order]Pour adapter le code :
- Ne rien modifier dans le code ci-dessus.
Étape 3 : Taux de notification non pondéré
Étape 3.1 : Calculer le taux pour un seul indicateur
Définir l’indicateur (conf) et le niveau d’unité administrative (adm3), appeler la fonction définie à l’Étape 2 et enregistrer le résultat pour une utilisation en aval.
indicator <- "conf"
level <- 3
df_rr <- compute_rep_rate(panel_df, level, indicator)
# enregistrer pour les workflows de stratification et correction de charge en aval
save_path <- here::here(
"01_data",
"1.2_epidemiology",
"1.2a_routine_surveillance",
"processed"
)
saveRDS(
df_rr,
here::here(
save_path,
paste0("monthly_", indicator, "_reprate_adm", level, ".rds")
)
)Pour adapter le code :
- Ligne 1 : Remplacer
"conf"par l’indicateur à calculer. - Ligne 2 : Définir
levelde 0 à 3 pour national à chefferie.
from pathlib import Path
import pandas as pd
from pyprojroot import here
indicator = "conf"
level = 3
df_rr = compute_rep_rate(panel_df, level, indicator)
# enregistrer pour les workflows de stratification et correction de charge en aval
save_path = Path(here(
"01_data/1.2_epidemiology"
"/1.2a_routine_surveillance/processed"
))
df_rr.to_parquet(
save_path / f"monthly_{indicator}_reprate_adm{level}.parquet",
index=False,
)Pour adapter le code :
- Ligne 6 : Remplacer
"conf"par l’indicateur à calculer. - Ligne 7 : Définir
levelde 0 à 3 pour national à chefferie.
TipOption de code alternative avec le paquet
sntutils
sntutils::calculate_reporting_metrics() fait la même chose en un seul appel (classification de l’activité des établissements plus taux de notification par groupe) et retourne un tableau avec les mêmes colonnes rep, exp, reprate, missrate que produit notre compute_rep_rate().
df_rr <- sntutils::calculate_reporting_metrics(
data = dhis2_df,
vars_of_interest = "conf",
x_var = "yearmon",
y_var = paste0("adm", level),
hf_col = "hf_uid",
key_indicators = c("allout", "conf", "test", "treat", "pres"),
# méthode : 1 = permanent, 2 = premier-au-dernier, 3 = dynamique
method = 2,
# fenêtre de grâce / dynamique en mois
nonreport_window = 6
)Étape 4 : Taux de notification pondéré
Étape 4.1 : Calculer le taux pondéré
Nous exécutons maintenant la version pondérée du taux de notification, en utilisant l’approche mobile sur 12 mois décrite dans Calcul du taux de notification pondéré ci-dessus. Nous y avons recours chaque fois que nous prévoyons d’alimenter le résultat dans l’ajustement de la charge, car un district où manque un hôpital de référence un mois perd bien plus de cas qu’un district où manque une petite clinique, et seul le taux pondéré capture cela. Même panel_df, même indicateur et même niveau admin que l’Étape 3.1 ; la fonction retourne les mêmes colonnes rep / exp / reprate / missrate plus les équivalents pondérés reprate_w et missrate_w, ainsi que des statistiques de synthèse pour la variable proxy de taille.
Afficher le code
compute_rep_rate_weighted <- function(
panel_df,
level,
indicator,
weight_var = "test",
weight_window = 12,
exclude_current_x = TRUE,
cold_start = "median_within_y"
) {
level_col <- paste0("adm", level)
group_vars <- c("yearmon", level_col)
# 1. typical_size : moyenne mobile de weight_var sur les weight_window mois
# précédents pour chaque établissement. calculée sur le panel équilibré
# complet afin que la fenêtre respecte l'espacement calendaire — les mois
# où un établissement était inactif entrent comme NA et sortent via na.rm.
before_n <- if (exclude_current_x) weight_window else weight_window - 1
after_n <- if (exclude_current_x) -1L else 0L
weight_data <- panel_df |>
dplyr::arrange(hf_uid, date) |>
dplyr::group_by(hf_uid) |>
dplyr::mutate(
typical_size = slider::slide_dbl(
.data[[weight_var]],
base::mean,
na.rm = TRUE,
.before = before_n,
.after = after_n,
.complete = FALSE
),
is_cold_start = is.na(typical_size)
) |>
dplyr::ungroup()
# 2. valeur de secours cold-start.
# un couple établissement-mois est un « cold-start » si sa fenêtre mobile
# n'avait pas de données utilisables — typiquement un établissement
# nouvellement ouvert dont les premiers weight_window mois dans le panel
# sont NA, ou un établissement dans les premiers mois du jeu de données
# sans historique préalable. on ne peut pas supprimer ces lignes (ce sont
# encore des couples établissement-mois actifs qui ont besoin d'un poids),
# et on ne peut pas laisser typical_size comme NA (la ligne sortirait alors
# silencieusement de la normalisation au sein du groupe). on remplit donc
# typical_size en empruntant à un voisin :
#
# - cold_start = "median_within_y" (défaut) : la médiane de typical_size
# des établissements de la même unité admin qui ont un historique.
# suppose qu'un nouvel établissement ressemble à un établissement
# typique de son district.
# - cold_start = "median_global" : la médiane globale sur tous les
# couples établissement-mois « chauds ». utiliser quand les unités
# admin sont petites ou quand la médiane intra-admin est elle-même peu
# fiable.
#
# is_cold_start est capturé avant coalesce afin que le contrôle qa
# ci-dessous puisse toujours signaler combien de couples ont eu besoin du
# secours.
global_median <- stats::median(
weight_data$typical_size[!weight_data$is_cold_start],
na.rm = TRUE
)
if (cold_start == "median_within_y") {
within_y_median <- weight_data |>
dplyr::filter(!is_cold_start) |>
dplyr::group_by(dplyr::across(dplyr::all_of(level_col))) |>
dplyr::summarise(
cold_start_value = stats::median(typical_size, na.rm = TRUE),
.groups = "drop"
)
weight_data <- weight_data |>
dplyr::left_join(within_y_median, by = level_col) |>
dplyr::mutate(
typical_size = dplyr::coalesce(
typical_size, cold_start_value, global_median
)
)
} else {
weight_data <- weight_data |>
dplyr::mutate(
typical_size = dplyr::coalesce(typical_size, global_median)
)
}
# 3. normaliser les poids pour qu'ils somment à 1 au sein de yearmon × adm.
weight_data <- weight_data |>
dplyr::group_by(dplyr::across(dplyr::all_of(group_vars))) |>
dplyr::mutate(
weight = typical_size / sum(typical_size, na.rm = TRUE),
weight = dplyr::if_else(
is.na(weight) | is.infinite(weight), 0, weight
)
) |>
dplyr::ungroup()
# 4. qa : avertir si les poids d'un groupe ne somment pas à 1, et si plus
# de 25 % des couples établissement-mois *actifs* dans une période sont des
# cold-starts.
weight_check <- weight_data |>
dplyr::group_by(dplyr::across(dplyr::all_of(group_vars))) |>
dplyr::summarise(
weight_sum = sum(weight, na.rm = TRUE),
.groups = "drop"
) |>
dplyr::filter(abs(weight_sum - 1) > 1e-6)
if (nrow(weight_check) > 0) {
cli::cli_warn(c(
"!" = "Les poids ne somment pas à 1 dans {nrow(weight_check)} groupes",
"i" = "Vérifier la qualité des données et les calculs de poids"
))
}
cold_start_check <- weight_data |>
dplyr::filter(is_active) |>
dplyr::group_by(yearmon) |>
dplyr::summarise(
n_total = dplyr::n(),
n_cold_start = sum(is_cold_start),
prop_cold_start = n_cold_start / n_total,
.groups = "drop"
) |>
dplyr::filter(prop_cold_start > 0.25)
if (nrow(cold_start_check) > 0) {
cli::cli_warn(c(
"!" = ">25 % de cold starts dans {nrow(cold_start_check)} périodes",
"i" = "Envisager d'ajuster weight_window ou la plage de données"
))
}
# 5. filtre actif : supprimer les couples inactifs avant l'agrégation
# afin que le dénominateur pondéré corresponde au non pondéré.
data_with_weights <- weight_data |>
dplyr::filter(is_active) |>
dplyr::mutate(
reported_any_var = !is.na(.data[[indicator]])
)
# 6. agrégation par établissement au sein de yearmon × adm. chaque
# établissement a une ligne par période dans le panel équilibré, donc
# cette étape se réduit à l'identité, mais le pas explicite rend le
# résumé par groupe ci-dessous facile à lire.
facility_summary <- data_with_weights |>
dplyr::group_by(
dplyr::across(dplyr::all_of(c(group_vars, "hf_uid")))
) |>
dplyr::summarise(
reported_facility = any(reported_any_var),
weight_facility = base::mean(weight, na.rm = TRUE),
weight_value_facility = base::mean(.data[[weight_var]], na.rm = TRUE),
.groups = "drop"
)
# 7. agrégation par groupe : rep / exp / reprate / missrate non pondérés,
# reprate_w / missrate_w pondérés, et statistiques de synthèse de weight_var.
facility_summary |>
dplyr::group_by(dplyr::across(dplyr::all_of(group_vars))) |>
dplyr::summarise(
rep = sum(reported_facility),
exp = dplyr::n(),
w_num = sum(weight_facility * reported_facility, na.rm = TRUE),
w_den = sum(weight_facility, na.rm = TRUE),
reprate_w = dplyr::if_else(w_den > 0, w_num / w_den, NA_real_),
missrate_w = dplyr::if_else(!is.na(reprate_w), 1 - reprate_w, NA_real_),
!!paste0("avg_", weight_var) :=
base::mean(weight_value_facility, na.rm = TRUE),
!!paste0("min_", weight_var) :=
base::min(weight_value_facility, na.rm = TRUE),
!!paste0("max_", weight_var) :=
base::max(weight_value_facility, na.rm = TRUE),
.groups = "drop"
) |>
dplyr::mutate(
reprate = dplyr::if_else(exp > 0, rep / exp, NA_real_),
missrate = dplyr::if_else(!is.na(reprate), 1 - reprate, NA_real_),
indicator = indicator
) |>
dplyr::select(
dplyr::all_of(group_vars),
indicator,
rep, exp, reprate, missrate,
reprate_w, missrate_w,
dplyr::starts_with("avg_"),
dplyr::starts_with("min_"),
dplyr::starts_with("max_")
)
}
df_rr_w <- compute_rep_rate_weighted(
panel_df, level, indicator,
weight_var = "test"
)Pour adapter le code :
- Ligne 5 : Passer un
weight_vardifférent (par exemple,"allout","conf") si le programme pondère les établissements par un indicateur différent. - Ligne 6 : Ajuster
weight_windowpour un historique mobile plus long ou plus court. - Ligne 7 : Définir
exclude_current_x = FALSEpour inclure la période en cours dans sa propre fenêtre (correspond à certaines implémentations héritées). - Ligne 8 : Définir
cold_start = "median_global"pour revenir directement à la médiane globale plutôt qu’à la médiane intra-admin.
Afficher le code
import numpy as np
import pandas as pd
def compute_rep_rate_weighted(
panel_df,
level,
indicator,
weight_var="test",
weight_window=12,
exclude_current_x=True,
cold_start="median_within_y",
):
"""
Calcule le taux de notification mensuel pondéré. Miroir colonne par
colonne de R compute_rep_rate_weighted().
"""
level_col = f"adm{level}"
group_vars = ["yearmon", level_col]
# 1. typical_size : moyenne mobile sur les weight_window mois précédents,
# excluant la période en cours quand exclude_current_x est True.
# le rolling pandas est sur les lignes ; trier par hf_uid + date d'abord.
weight_data = panel_df.sort_values(["hf_uid", "date"]).copy()
# décaler les bornes de la fenêtre pour correspondre à slider::slide_dbl
# before = weight_window, after = -1 ➜ exclure la ligne en cours
# before = weight_window - 1, after = 0 ➜ inclure la ligne en cours
window = weight_window # toujours regarder en arrière ce nombre de lignes
def _rolling_mean(g):
g = g.copy()
vals = g[weight_var].copy()
if exclude_current_x:
# exclure le courant : décaler de 1 pour que la fenêtre couvre t-12..t-1
shifted = vals.shift(1)
g["typical_size"] = (
shifted.rolling(window=window, min_periods=1).mean()
)
else:
# inclure le courant : la fenêtre couvre t-(window-1)..t
g["typical_size"] = (
vals.rolling(window=window, min_periods=1).mean()
)
g["is_cold_start"] = g["typical_size"].isna()
return g
weight_data = (
weight_data
.groupby("hf_uid", group_keys=False)
.apply(_rolling_mean)
.reset_index(drop=True)
)
# 2. valeur de secours cold-start
global_median = weight_data.loc[
~weight_data["is_cold_start"], "typical_size"
].median()
if cold_start == "median_within_y" and level > 0:
within_y_median = (
weight_data.loc[~weight_data["is_cold_start"]]
.groupby(level_col, as_index=False)
.agg(cold_start_value=("typical_size", "median"))
)
weight_data = weight_data.merge(within_y_median, on=level_col, how="left")
weight_data["typical_size"] = (
weight_data["typical_size"]
.fillna(weight_data["cold_start_value"])
.fillna(global_median)
)
else:
weight_data["typical_size"] = (
weight_data["typical_size"].fillna(global_median)
)
# 3. normaliser les poids pour qu'ils somment à 1 au sein de yearmon × adm
grp_cols_w = group_vars
weight_data["_group_sum"] = (
weight_data.groupby(grp_cols_w)["typical_size"]
.transform("sum")
)
weight_data["weight"] = np.where(
weight_data["_group_sum"] > 0,
weight_data["typical_size"] / weight_data["_group_sum"],
0.0,
)
weight_data["weight"] = weight_data["weight"].replace(
[np.inf, -np.inf], 0.0
).fillna(0.0)
# 4. avertissements qa
weight_check = (
weight_data
.groupby(grp_cols_w, as_index=False)
.agg(weight_sum=("weight", "sum"))
.loc[lambda d: (d["weight_sum"] - 1).abs() > 1e-6]
)
if len(weight_check) > 0:
cli_warning(
f"Les poids ne somment pas à 1 dans {len(weight_check)} groupes — "
"vérifier la qualité des données et les calculs de poids"
)
cold_check = (
weight_data.loc[weight_data["is_active"]]
.groupby("yearmon", as_index=False)
.apply(
lambda g: pd.Series({
"n_total": len(g),
"n_cold_start": g["is_cold_start"].sum(),
}),
include_groups=False,
)
.reset_index(drop=True)
)
cold_check["prop_cold_start"] = (
cold_check["n_cold_start"] / cold_check["n_total"]
)
cold_check = cold_check.loc[cold_check["prop_cold_start"] > 0.25]
if len(cold_check) > 0:
cli_warning(
f">25 % de cold starts dans {len(cold_check)} périodes — "
"envisager d'ajuster weight_window ou la plage de données"
)
# 5. filtre actif
active_w = weight_data.loc[weight_data["is_active"]].copy()
active_w["reported_any_var"] = active_w[indicator].notna()
# 6. agrégation par établissement au sein de yearmon × adm
fac_grp = grp_cols_w + ["hf_uid"]
facility_summary = (
active_w
.groupby(fac_grp, as_index=False)
.agg(
reported_facility=("reported_any_var", "any"),
weight_facility=(f"weight", "mean"),
weight_value_facility=(weight_var, "mean"),
)
)
# 7. agrégation par groupe
def _group_agg(g):
rep = int(g["reported_facility"].sum())
exp = len(g)
w_num = (g["weight_facility"] * g["reported_facility"]).sum()
w_den = g["weight_facility"].sum()
rr_w = w_num / w_den if w_den > 0 else np.nan
return pd.Series({
"rep": rep,
"exp": exp,
"w_num": w_num,
"w_den": w_den,
"reprate_w": rr_w,
"missrate_w": (1 - rr_w) if not np.isnan(rr_w) else np.nan,
f"avg_{weight_var}": g["weight_value_facility"].mean(),
f"min_{weight_var}": g["weight_value_facility"].min(),
f"max_{weight_var}": g["weight_value_facility"].max(),
})
result = (
facility_summary
.groupby(grp_cols_w, as_index=False)
.apply(_group_agg, include_groups=False)
.reset_index(drop=True)
)
result = result.assign(
reprate=lambda d: np.where(d["exp"] > 0, d["rep"] / d["exp"], np.nan),
missrate=lambda d: np.where(
d["reprate"].notna(), 1 - d["reprate"], np.nan
),
indicator=indicator,
)
col_order = (
grp_cols_w
+ ["indicator", "rep", "exp", "reprate", "missrate",
"reprate_w", "missrate_w",
f"avg_{weight_var}", f"min_{weight_var}", f"max_{weight_var}"]
)
return result[col_order]
df_rr_w = compute_rep_rate_weighted(
panel_df, level, indicator,
weight_var="test",
)Pour adapter le code :
- Ligne 8 : Passer un
weight_vardifférent (par exemple,"allout","conf") si le programme pondère les établissements par un indicateur différent. - Ligne 9 : Ajuster
weight_windowpour un historique mobile plus long ou plus court. - Ligne 10 : Définir
exclude_current_x=Falsepour inclure la période en cours dans sa propre fenêtre (correspond à certaines implémentations héritées). - Ligne 11 : Définir
cold_start="median_global"pour revenir directement à la médiane globale plutôt qu’à la médiane intra-admin.
TipOption de code alternative avec le paquet
sntutils
sntutils::calculate_reporting_metrics(weighting = TRUE) fait la même chose en un seul appel (classification de l’activité des établissements, poids de taille habituelle mobiles, valeur de secours cold-start et agrégation pondérée) et retourne un tableau avec les mêmes colonnes rep, exp, reprate, missrate, reprate_w, missrate_w que produit notre compute_rep_rate_weighted().
df_rr_w <- sntutils::calculate_reporting_metrics(
data = dhis2_df,
vars_of_interest = "conf",
x_var = "yearmon",
y_var = paste0("adm", level),
hf_col = "hf_uid",
key_indicators = c("allout", "conf", "test", "treat", "pres"),
method = 2,
nonreport_window = 6,
weighting = TRUE,
weight_var = "test",
weight_window = 12,
exclude_current_x = TRUE,
cold_start = "median_within_y"
)Étape 4.2 : Comparer les taux pondérés et non pondérés
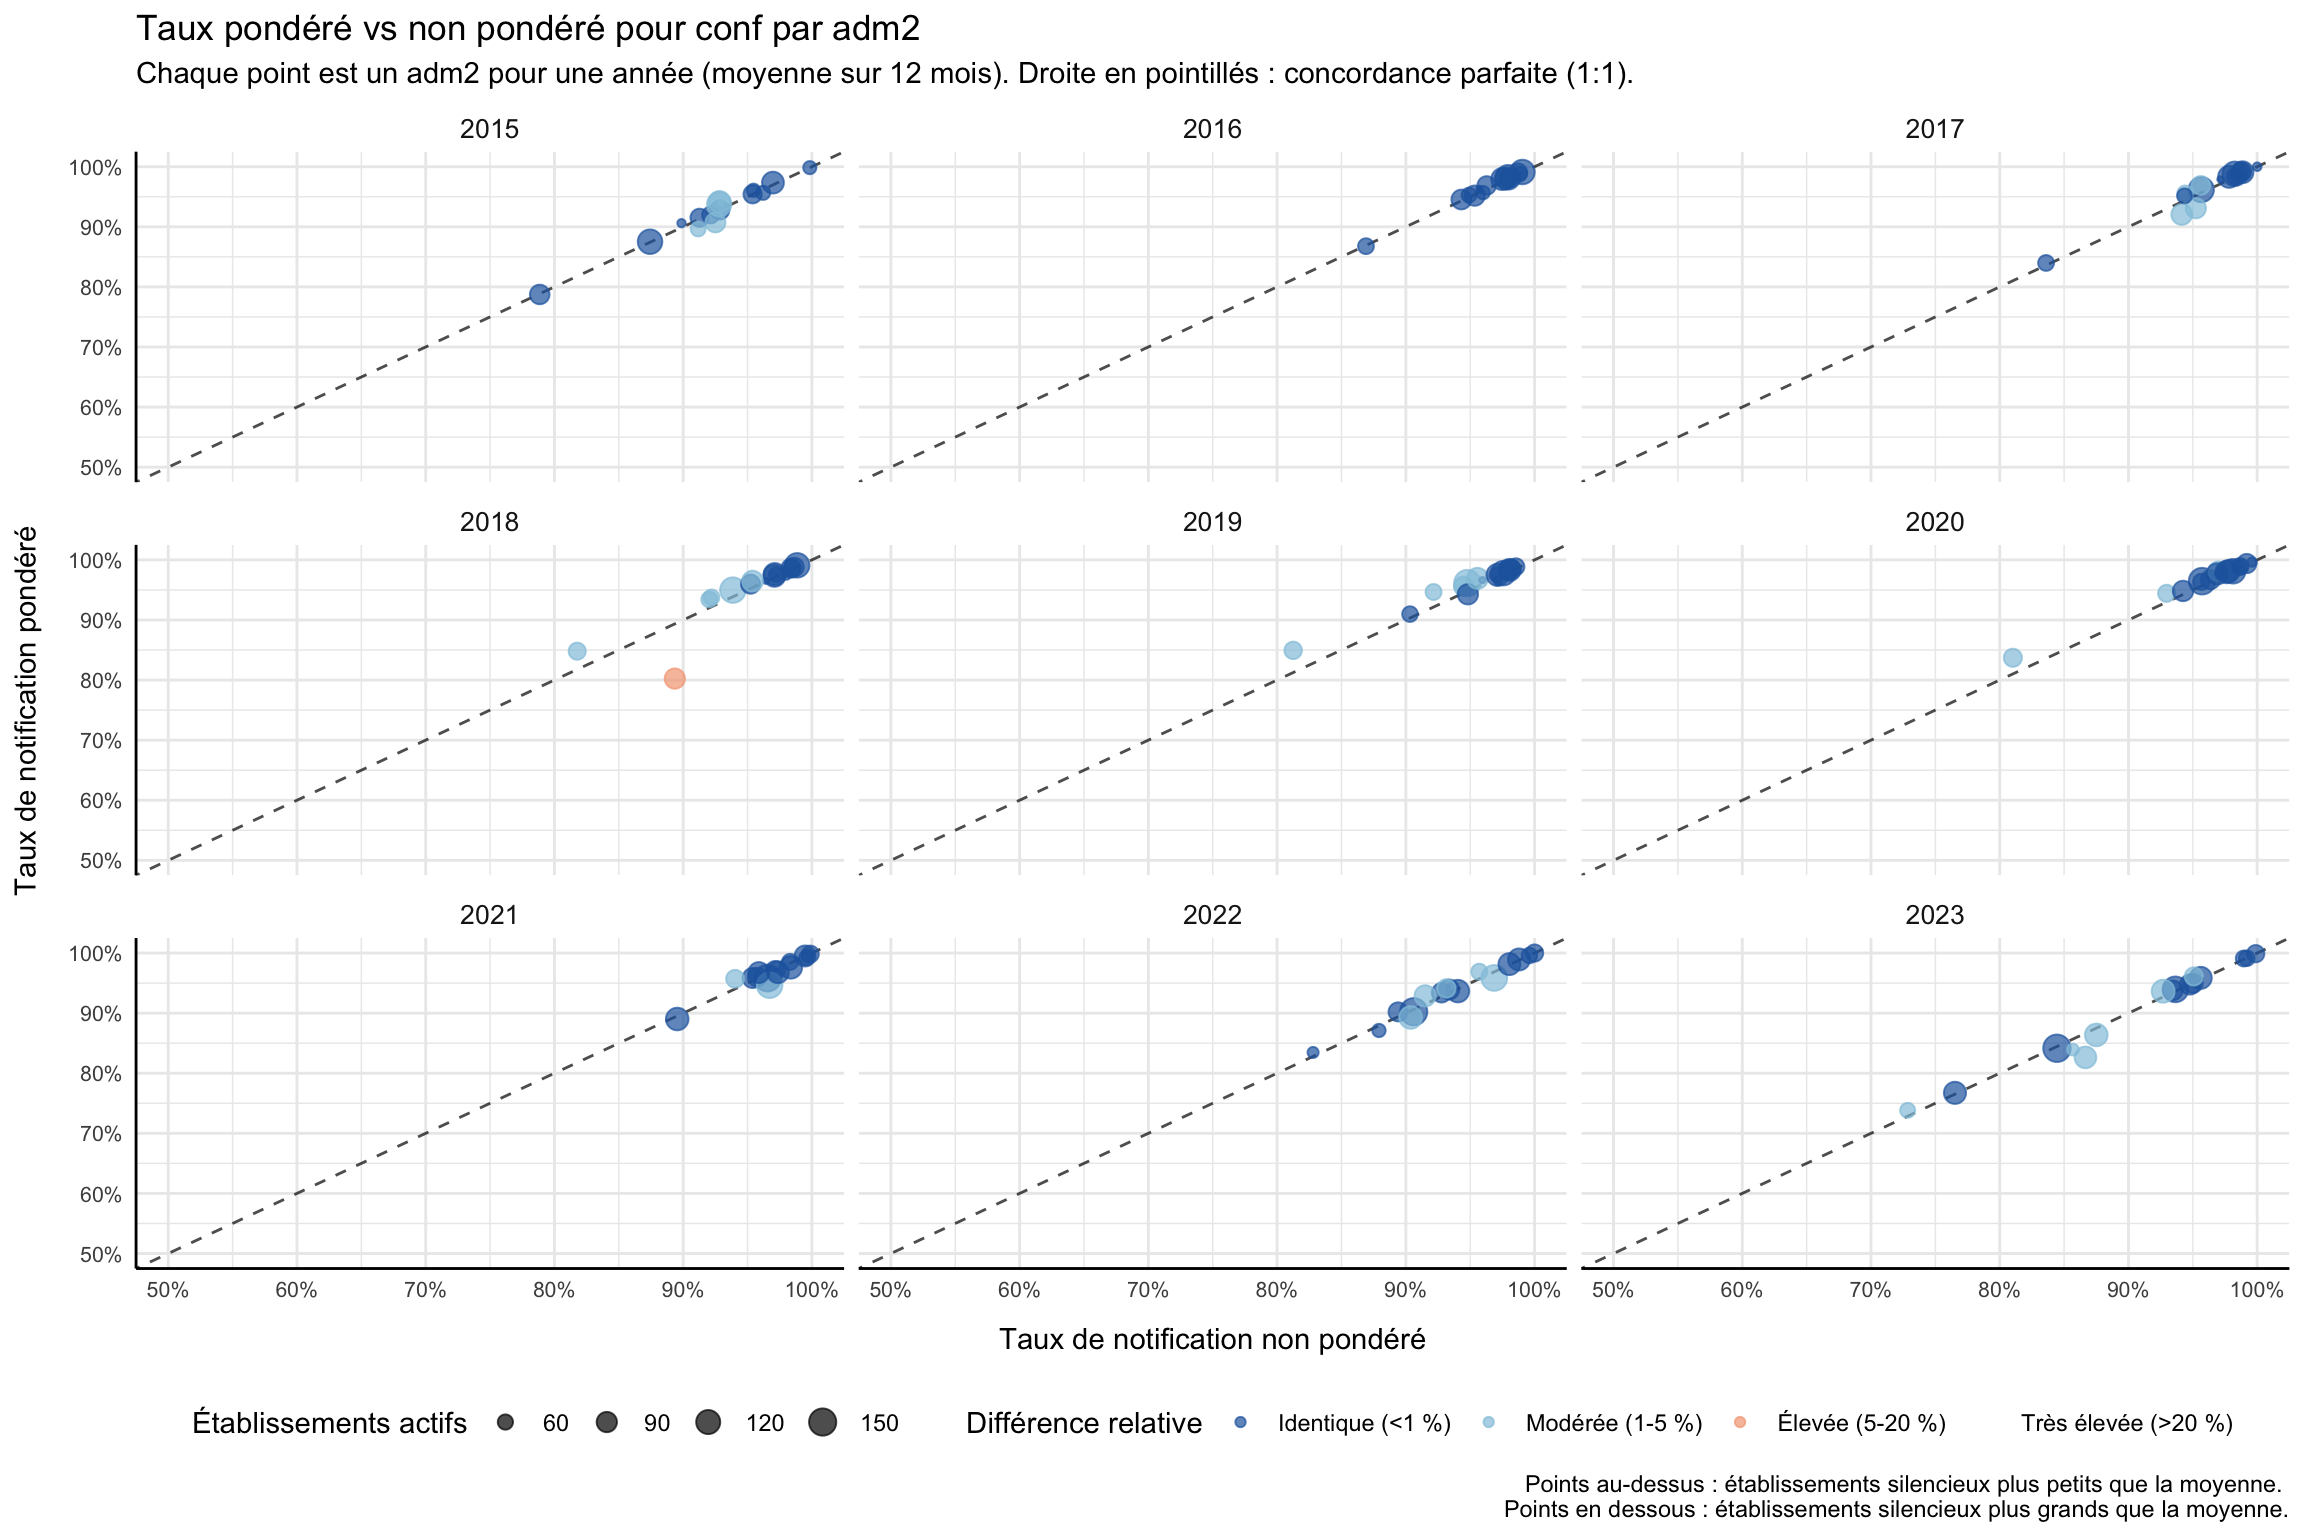
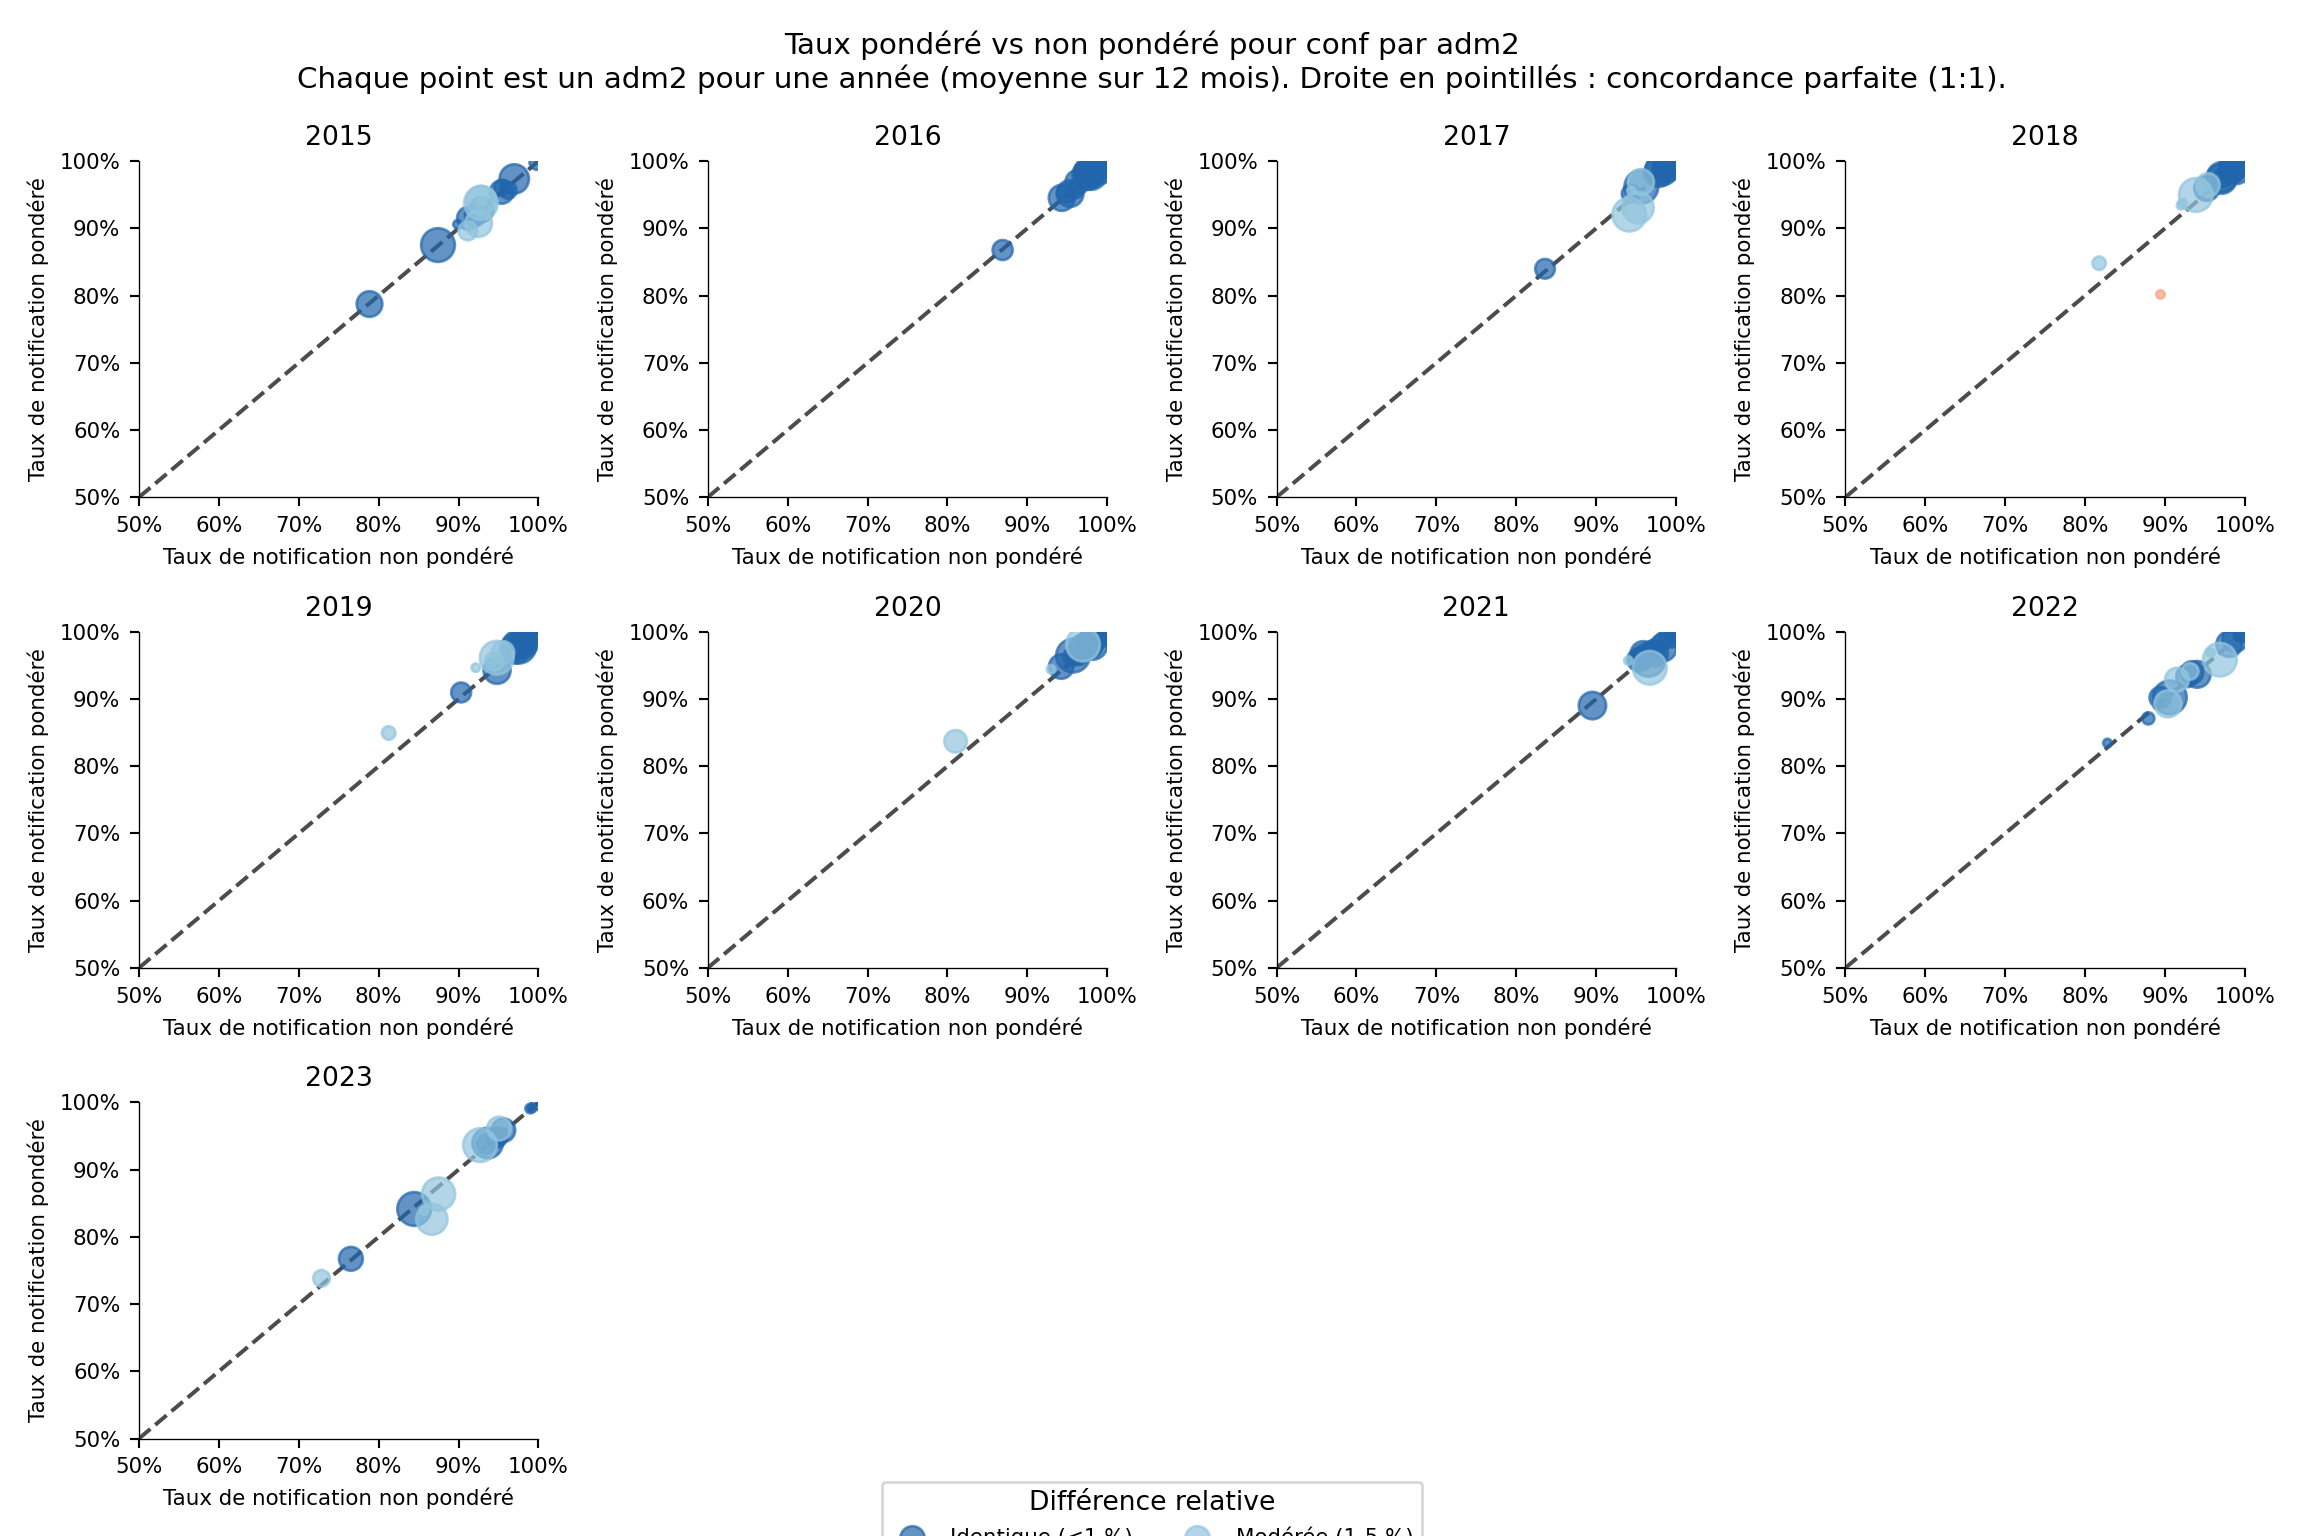
La comparaison est diagnostique : un grand écart entre pondéré et non pondéré révèle que les plus grands contributeurs notifient différemment de l’établissement moyen. Nous traçons un nuage de points par adm2 du taux non pondéré (axe x) contre le pondéré (axe y) avec une droite de référence 1:1 en pointillés. Les points au-dessus de la droite signifient que les établissements silencieux sont plus petits que la moyenne ; les points en dessous signifient que les établissements silencieux sont plus grands (le mode d’échec qui nuit le plus aux estimations de charge). Nous recalculons les deux taux à adm2, moyennons chaque paire (adm2 × année) sur ses 12 mois, classons l’écart relatif en quatre niveaux et traçons.
Afficher le code
# taux de notification non pondéré et pondéré à adm2 pour l'indicateur en cours
df_rr_adm2 <- compute_rep_rate(panel_df, 2, indicator)
df_rr_w_adm2 <- compute_rep_rate_weighted(
panel_df, 2, indicator,
weight_var = "test"
)
# un point par (adm2 × année) : moyenner les 12 mois de chaque année afin
# que chaque panneau du nuage montre le même ensemble de districts.
df_compare_adm2 <- df_rr_adm2 |>
dplyr::select(yearmon, adm2, reprate, exp) |>
dplyr::left_join(
df_rr_w_adm2 |> dplyr::select(yearmon, adm2, reprate_w),
by = c("yearmon", "adm2")
) |>
dplyr::mutate(year = substr(yearmon, 1, 4)) |>
dplyr::group_by(adm2, year) |>
dplyr::summarise(
reprate = base::mean(reprate, na.rm = TRUE),
reprate_w = base::mean(reprate_w, na.rm = TRUE),
n_active = base::mean(exp, na.rm = TRUE),
.groups = "drop"
) |>
dplyr::mutate(
# différence relative en pourcentage (protection contre la division par zéro)
relat_diff_pct = 100 *
base::abs(reprate_w - reprate) /
base::pmax(reprate, .Machine$double.eps),
diff_tier = dplyr::case_when(
relat_diff_pct >= 20 ~ "Very High",
relat_diff_pct >= 5 ~ "High",
relat_diff_pct >= 1 ~ "Moderate",
TRUE ~ "Same"
),
diff_tier = base::factor(
diff_tier,
levels = c("Same", "Moderate", "High", "Very High")
)
)
# x = non pondéré, y = pondéré ; la droite en pointillés marque la concordance parfaite.
ggplot2::ggplot(
df_compare_adm2,
ggplot2::aes(x = reprate, y = reprate_w)
) +
ggplot2::geom_abline(
slope = 1, intercept = 0,
color = "black", linetype = "dashed", alpha = 0.7
) +
ggplot2::geom_point(
ggplot2::aes(color = diff_tier, size = n_active),
alpha = 0.7, na.rm = TRUE
) +
ggplot2::scale_color_manual(
name = "Différence relative",
values = c(
"Same" = "#2166ac",
"Moderate" = "#92c5de",
"High" = "#f4a582",
"Very High" = "#b2182b"
),
labels = c(
"Same" = "Identique (<1 %)",
"Moderate" = "Modérée (1-5 %)",
"High" = "Élevée (5-20 %)",
"Very High" = "Très élevée (>20 %)"
),
drop = FALSE
) +
ggplot2::scale_size_continuous(
name = "Établissements actifs",
range = c(0.5, 4.5),
labels = scales::comma_format()
) +
ggplot2::scale_x_continuous(labels = scales::percent_format(accuracy = 1)) +
ggplot2::scale_y_continuous(labels = scales::percent_format(accuracy = 1)) +
ggplot2::coord_cartesian(xlim = c(0.5, 1), ylim = c(0.5, 1)) +
ggplot2::facet_wrap(~ year) +
ggplot2::labs(
title = paste0(
"Taux pondéré vs non pondéré pour ", indicator,
" par adm2"
),
subtitle = paste(
"Chaque point est un adm2 pour une année (moyenne sur 12 mois).",
"Droite en pointillés : concordance parfaite (1:1)."
),
x = "Taux de notification non pondéré",
y = "Taux de notification pondéré",
caption = paste(
"Points au-dessus : établissements silencieux plus petits que la moyenne.",
"\nPoints en dessous : établissements silencieux plus grands que la moyenne."
)
) +
ggplot2::theme_minimal() +
ggplot2::theme(
strip.text = ggplot2::element_text(size = 10),
axis.text = ggplot2::element_text(size = 8),
axis.line = ggplot2::element_line(color = "black", linewidth = 0.5),
legend.position = "bottom",
legend.spacing.x = ggplot2::unit(0.5, "cm"),
axis.title.x = ggplot2::element_text(margin = ggplot2::margin(t = 10)),
axis.title.y = ggplot2::element_text(margin = ggplot2::margin(r = 10))
)
NoteSortie
Pour adapter le code :
- Ne rien modifier dans le code ci-dessus.
Afficher le code
import matplotlib.pyplot as plt
import numpy as np
import pandas as pd
# taux de notification non pondéré et pondéré à adm2 pour l'indicateur en cours
df_rr_adm2 = compute_rep_rate(panel_df, 2, indicator)
df_rr_w_adm2 = compute_rep_rate_weighted(
panel_df, 2, indicator, weight_var="test"
)
# un point par (adm2 × année) : moyenner les 12 mois de chaque année
df_compare_adm2 = (
df_rr_adm2[["yearmon", "adm2", "reprate", "exp"]]
.merge(
df_rr_w_adm2[["yearmon", "adm2", "reprate_w"]],
on=["yearmon", "adm2"],
)
.assign(year=lambda d: d["yearmon"].str[:4])
.groupby(["adm2", "year"], as_index=False)
.agg(
reprate=("reprate", "mean"),
reprate_w=("reprate_w", "mean"),
n_active=("exp", "mean"),
)
)
# classer la différence relative
eps = np.finfo(float).eps
df_compare_adm2 = df_compare_adm2.assign(
relat_diff_pct=lambda d: (
100 * (d["reprate_w"] - d["reprate"]).abs()
/ d["reprate"].clip(lower=eps)
),
diff_tier=lambda d: pd.Categorical(
np.select(
[
d["relat_diff_pct"] >= 20,
d["relat_diff_pct"] >= 5,
d["relat_diff_pct"] >= 1,
],
["Very High", "High", "Moderate"],
default="Same",
),
categories=["Same", "Moderate", "High", "Very High"],
ordered=True,
),
)
tier_colors = {
"Same": "#2166ac",
"Moderate": "#92c5de",
"High": "#f4a582",
"Very High": "#b2182b",
}
tier_labels = {
"Same": "Identique (<1 %)",
"Moderate": "Modérée (1-5 %)",
"High": "Élevée (5-20 %)",
"Very High": "Très élevée (>20 %)",
}
years = sorted(df_compare_adm2["year"].unique())
n_cols = min(len(years), 4)
n_rows = (len(years) + n_cols - 1) // n_cols
fig, axes = plt.subplots(n_rows, n_cols, figsize=(12, 8), squeeze=False)
axes_flat = axes.flatten()
for ax_idx, yr in enumerate(years):
ax = axes_flat[ax_idx]
sub = df_compare_adm2.loc[df_compare_adm2["year"] == yr]
# droite de référence 1:1 en pointillés
ax.axline((0.5, 0.5), slope=1, color="black", linestyle="--", alpha=0.7)
for tier in ["Same", "Moderate", "High", "Very High"]:
pts = sub.loc[sub["diff_tier"] == tier]
if pts.empty:
continue
# mettre à l'échelle la taille des bulles pour correspondre à ggplot scale_size range(0.5, 4.5)
sz_norm = (pts["n_active"] - pts["n_active"].min()) / (
pts["n_active"].max() - pts["n_active"].min() + 1e-9
)
sizes = 10 + sz_norm * 150
ax.scatter(
pts["reprate"],
pts["reprate_w"],
c=tier_colors[tier],
s=sizes,
alpha=0.7,
label=tier_labels[tier],
zorder=3,
)
ax.set_xlim(0.5, 1)
ax.set_ylim(0.5, 1)
ax.xaxis.set_major_formatter(mticker.PercentFormatter(xmax=1, decimals=0))
ax.yaxis.set_major_formatter(mticker.PercentFormatter(xmax=1, decimals=0))
ax.set_title(yr, fontsize=10)
ax.tick_params(labelsize=8)
ax.spines[["top", "right"]].set_visible(False)
ax.spines[["left", "bottom"]].set_linewidth(0.5)
ax.set_xlabel("Taux de notification non pondéré", fontsize=8)
ax.set_ylabel("Taux de notification pondéré", fontsize=8)
# masquer les axes inutilisés
for ax in axes_flat[len(years):]:
ax.set_visible(False)
# légende partagée en bas
handles, labels_leg = axes_flat[0].get_legend_handles_labels()
seen = {}
unique_h, unique_l = [], []
for h, lbl in zip(handles, labels_leg):
if lbl not in seen:
seen[lbl] = True
unique_h.append(h)
unique_l.append(lbl)
fig.legend(
unique_h, unique_l,
title="Différence relative",
loc="lower center",
ncol=4,
fontsize=8,
bbox_to_anchor=(0.5, -0.02),
)
fig.suptitle(
f"Taux pondéré vs non pondéré pour {indicator} par adm2\n"
"Chaque point est un adm2 pour une année (moyenne sur 12 mois). "
"Droite en pointillés : concordance parfaite (1:1).",
fontsize=11,
y=1.01,
)
plt.tight_layout()
NoteSortie
Pour adapter le code :
- Ne rien modifier dans le code ci-dessus.
Étape 5 : Visualiser les taux de notification au niveau national
Étape 5.1 : Carte thermique multi-indicateurs
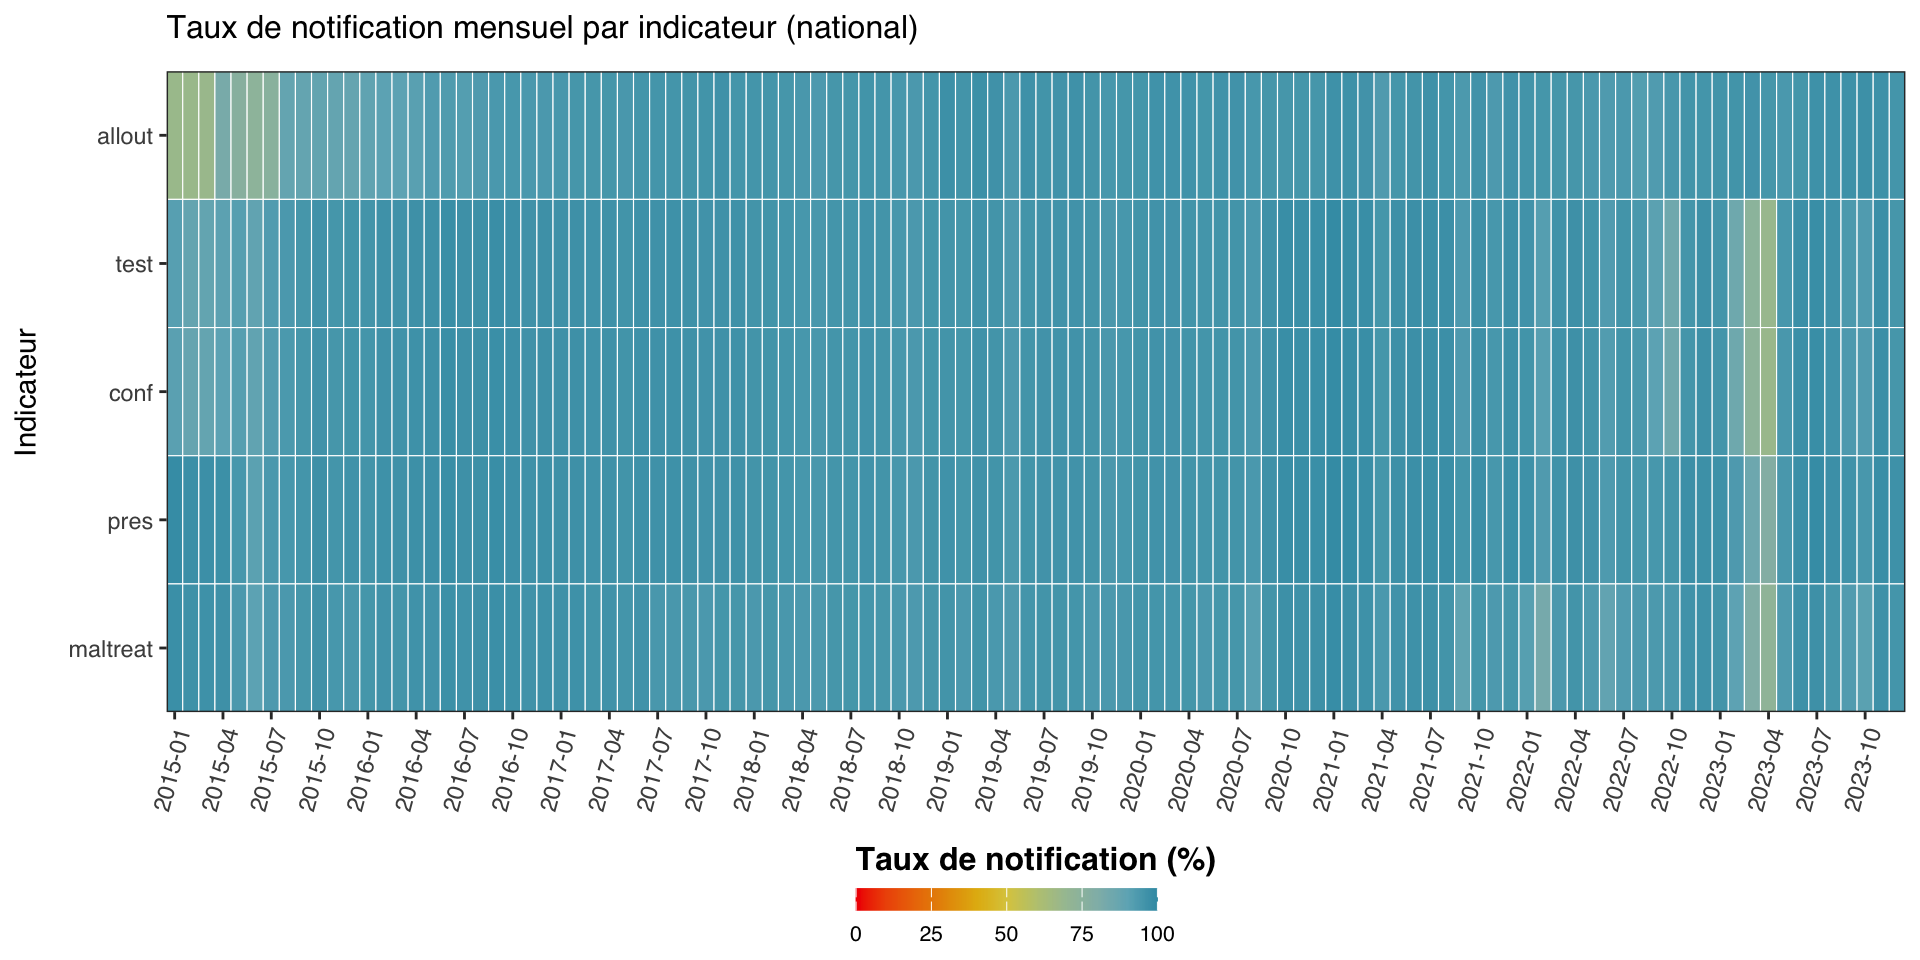
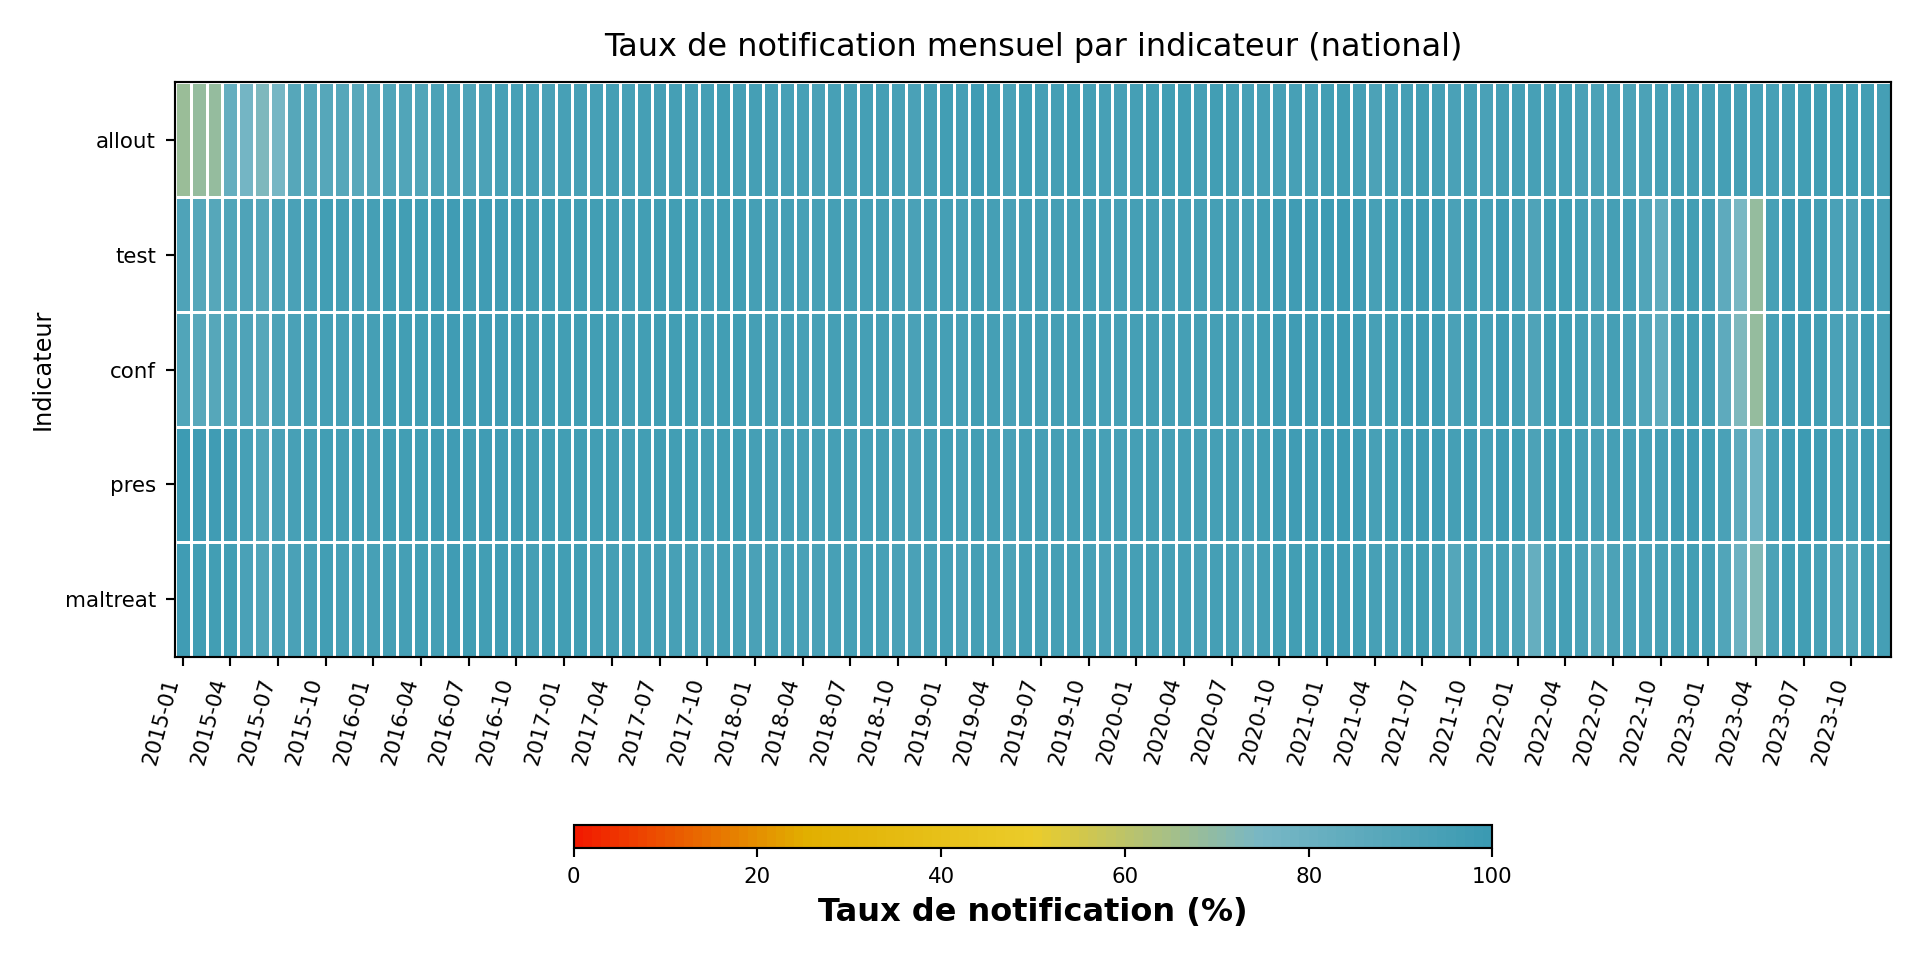
Les cartes thermiques facilitent la comparaison du taux de notification par indicateur (axe y) et par période (axe x) en un coup d’œil. Nous calculons le taux de notification pour plusieurs indicateurs au niveau national (level = 0), les assemblons dans un seul tableau ordonné et rendons une carte thermique colorée Zissou1.
Afficher le code
indicators <- c("allout", "test", "conf", "pres", "maltreat")
plot_data <- purrr::map_dfr(indicators, function(i) {
compute_rep_rate(panel_df, level = 0, indicator = i) |>
dplyr::transmute(
yearmon,
indicator,
rr_pct = reprate * 100
)
})
# un mois sur trois sur l'axe x pour garder les étiquettes lisibles
yearmon_levels <- unique(plot_data$yearmon)
x_breaks <- yearmon_levels[seq(1, length(yearmon_levels), by = 3)]
ggplot2::ggplot(
plot_data,
ggplot2::aes(
x = yearmon,
y = forcats::fct_relevel(indicator, rev(indicators)),
fill = rr_pct
)
) +
ggplot2::geom_tile(colour = "white", linewidth = .2) +
ggplot2::scale_fill_gradientn(
colours = rev(wesanderson::wes_palette(
"Zissou1", 100, type = "continuous"
)),
limits = c(0, 100),
na.value = "grey90"
) +
ggplot2::guides(
fill = ggplot2::guide_colorbar(
title.position = "top",
nrow = 1,
label.position = "bottom",
direction = "horizontal",
barheight = ggplot2::unit(0.3, "cm"),
barwidth = ggplot2::unit(4, "cm"),
ticks = TRUE,
draw.ulim = TRUE,
draw.llim = TRUE
)
) +
ggplot2::scale_x_discrete(breaks = x_breaks, expand = c(0, 0)) +
ggplot2::scale_y_discrete(expand = c(0, 0)) +
ggplot2::labs(
fill = "Taux de notification (%)",
x = NULL,
y = "Indicateur",
title = "Taux de notification mensuel par indicateur (national)"
) +
ggplot2::theme_bw() +
ggplot2::theme(
legend.title = ggplot2::element_text(
size = 12,
face = "bold",
family = "sans"
),
legend.position = "bottom",
legend.direction = "horizontal",
legend.box = "horizontal",
legend.box.just = "center",
legend.margin = ggplot2::margin(t = 0, unit = "cm"),
legend.text = ggplot2::element_text(
size = 8,
family = "sans"
),
axis.title.x = ggplot2::element_text(
margin = ggplot2::margin(t = 5, unit = "pt")
),
axis.title.y = ggplot2::element_text(
margin = ggplot2::margin(r = 10, unit = "pt")
),
axis.text.x = ggplot2::element_text(
angle = 75,
hjust = 1,
family = "sans"
),
axis.text = ggplot2::element_text(family = "sans"),
axis.title = ggplot2::element_text(family = "sans"),
plot.title = ggtext::element_markdown(
size = 12,
family = "sans",
margin = ggplot2::margin(b = 10)
),
panel.grid.minor = ggplot2::element_blank(),
panel.grid.major = ggplot2::element_blank(),
panel.background = ggplot2::element_blank()
)
NoteSortie
Pour adapter le code :
- Ligne 1 : Modifier
indicatorspour comparer un ensemble différent d’indicateurs.
Afficher le code
import matplotlib.colors as mcolors
import matplotlib.pyplot as plt
import numpy as np
import pandas as pd
indicators = ["allout", "test", "conf", "pres", "maltreat"]
_frames = []
for i in indicators:
_df = compute_rep_rate(panel_df, level=0, indicator=i)
_df["rr_pct"] = _df["reprate"] * 100
_frames.append(_df[["yearmon", "indicator", "rr_pct"]])
plot_data = pd.concat(_frames, ignore_index=True)
yearmon_levels = sorted(plot_data["yearmon"].unique())
# un mois sur trois sur l'axe x pour garder les étiquettes lisibles
x_breaks = yearmon_levels[::3]
# palette Zissou1 inversée pour le taux de notification (élevé = bleu = bien)
zissou1_colors = ["#3B9AB2", "#78B7C5", "#EBCC2A", "#E1AF00", "#F21A00"]
zissou1_cmap = mcolors.LinearSegmentedColormap.from_list(
"Zissou1", zissou1_colors, N=100
)
zissou1_r_cmap = zissou1_cmap.reversed()
# pivoter en matrice : lignes = indicateurs (bas vers haut), cols = yearmon
# R utilise fct_relevel(indicator, rev(indicators)) → premier indicateur en haut
ind_order = list(reversed(indicators))
pivot = (
plot_data
.pivot(index="indicator", columns="yearmon", values="rr_pct")
.reindex(index=ind_order, columns=yearmon_levels)
)
fig, ax = plt.subplots(figsize=(10, 5))
mesh = ax.pcolormesh(
np.arange(len(yearmon_levels) + 1),
np.arange(len(ind_order) + 1),
pivot.values,
cmap=zissou1_r_cmap,
vmin=0,
vmax=100,
linewidth=0.5,
edgecolors="white",
antialiased=False,
)
ax.set_aspect("auto")
# x-axis: show only x_breaks labels
xtick_pos = [yearmon_levels.index(ym) + 0.5 for ym in x_breaks]
ax.set_xticks(xtick_pos)
ax.set_xticklabels(x_breaks, rotation=75, ha="right", fontsize=8)
ax.set_yticks(np.arange(len(ind_order)) + 0.5)
ax.set_yticklabels(ind_order, fontsize=8)
ax.set_xlabel("")
ax.set_ylabel("Indicateur", fontsize=9)
ax.set_title(
"Taux de notification mensuel par indicateur (national)", fontsize=12, pad=10
)
ax.grid(False)
# barre de couleur horizontale en bas
cbar = fig.colorbar(
mesh, ax=ax, orientation="horizontal",
fraction=0.03, pad=0.22, aspect=40,
)
cbar.set_label("Taux de notification (%)", fontsize=12, fontweight="bold")
cbar.ax.tick_params(labelsize=8)
plt.tight_layout()
NoteSortie
Pour adapter le code :
- Ligne 6 : Modifier
indicatorspour comparer un ensemble différent d’indicateurs.
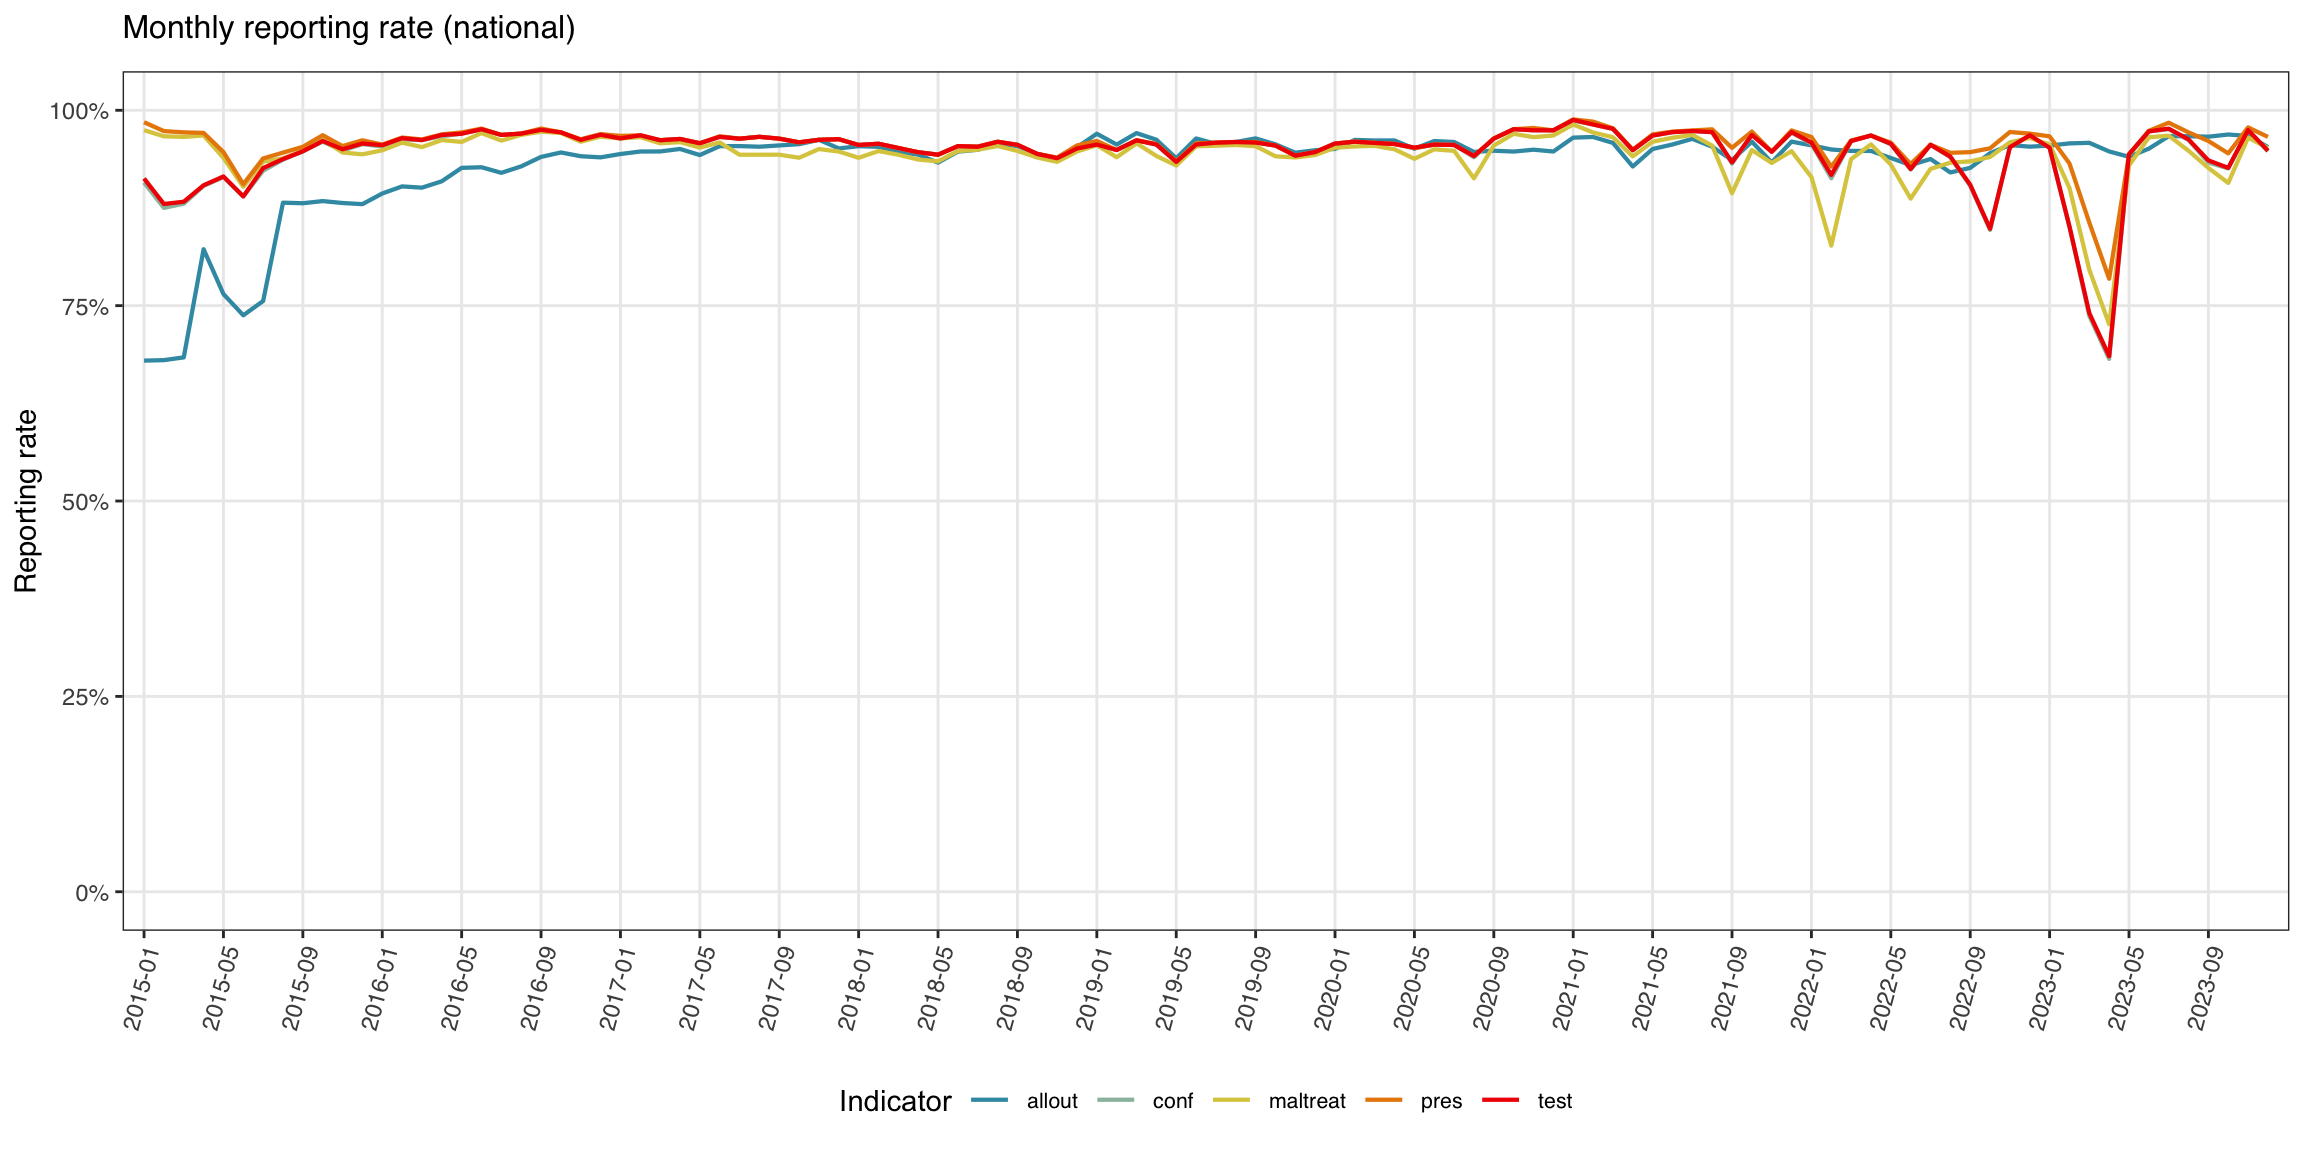
Étape 5.2 : Graphique linéaire multi-indicateurs
Le graphique linéaire est la vue plus traditionnelle : taux de notification sur l’axe y, période sur l’axe x, une ligne par indicateur.
Afficher le code
yearmon_levels <- unique(plot_data$yearmon)
x_breaks <- yearmon_levels[seq(1, length(yearmon_levels), by = 4)]
ggplot2::ggplot(
plot_data,
ggplot2::aes(
x = yearmon,
y = rr_pct / 100,
color = indicator,
group = indicator
)
) +
ggplot2::geom_line(linewidth = 0.75) +
ggplot2::scale_color_manual(
values = wesanderson::wes_palette("Zissou1", length(indicators),
type = "continuous")
) +
ggplot2::scale_x_discrete(breaks = x_breaks, expand = c(0.01, 0.01)) +
ggplot2::scale_y_continuous(labels = scales::percent_format(accuracy = 1)) +
ggplot2::coord_cartesian(ylim = c(0, 1)) +
ggplot2::labs(
x = NULL,
y = "Taux de notification",
title = "Taux de notification mensuel (national)",
color = "Indicateur"
) +
ggplot2::theme_bw() +
ggplot2::theme(
legend.position = "bottom",
legend.text = ggplot2::element_text(size = 8, family = "sans"),
axis.text.x = ggplot2::element_text(
angle = 75, hjust = 1, family = "sans"
),
axis.text = ggplot2::element_text(family = "sans"),
axis.title = ggplot2::element_text(family = "sans"),
plot.title = ggtext::element_markdown(
size = 12, family = "sans",
margin = ggplot2::margin(b = 10)
),
panel.grid.minor = ggplot2::element_blank()
)
NoteSortie
Pour adapter le code :
- Ne rien modifier dans le code ci-dessus.
Afficher le code
import matplotlib.colors as mcolors
import matplotlib.pyplot as plt
import numpy as np
yearmon_levels_line = sorted(plot_data["yearmon"].unique())
# un mois sur quatre sur l'axe x
x_breaks_line = yearmon_levels_line[::4]
# palette Zissou1 échantillonnée à len(indicators) positions (non inversée pour les lignes)
zissou1_line = mcolors.LinearSegmentedColormap.from_list(
"Zissou1", ["#3B9AB2", "#78B7C5", "#EBCC2A", "#E1AF00", "#F21A00"], N=100
)
n_ind = len(indicators)
line_colors = [zissou1_line(i / max(n_ind - 1, 1)) for i in range(n_ind)]
fig, ax = plt.subplots(figsize=(12, 6))
for idx, ind in enumerate(indicators):
sub = (
plot_data.loc[plot_data["indicator"] == ind]
.sort_values("yearmon")
)
# convertir le pourcentage en proportion pour l'axe y
ax.plot(
sub["yearmon"],
sub["rr_pct"] / 100,
linewidth=0.75,
color=line_colors[idx],
label=ind,
)
ax.set_xticks(
[yearmon_levels_line.index(ym) for ym in x_breaks_line]
)
ax.set_xticklabels(x_breaks_line, rotation=75, ha="right", fontsize=8)
ax.yaxis.set_major_formatter(mticker.PercentFormatter(xmax=1, decimals=0))
ax.set_ylim(0, 1)
ax.set_xlabel("")
ax.set_ylabel("Taux de notification", fontsize=9)
ax.set_title("Taux de notification mensuel (national)", fontsize=12, pad=10)
ax.tick_params(labelsize=8)
ax.legend(title="Indicateur", fontsize=8, loc="lower center",
ncol=len(indicators), bbox_to_anchor=(0.5, -0.35))
ax.grid(axis="y", linewidth=0.4, alpha=0.5)
ax.grid(axis="x", visible=False)
for spine in ["top", "right"]:
ax.spines[spine].set_visible(False)
plt.tight_layout()
NoteSortie
(0.0, 1.0)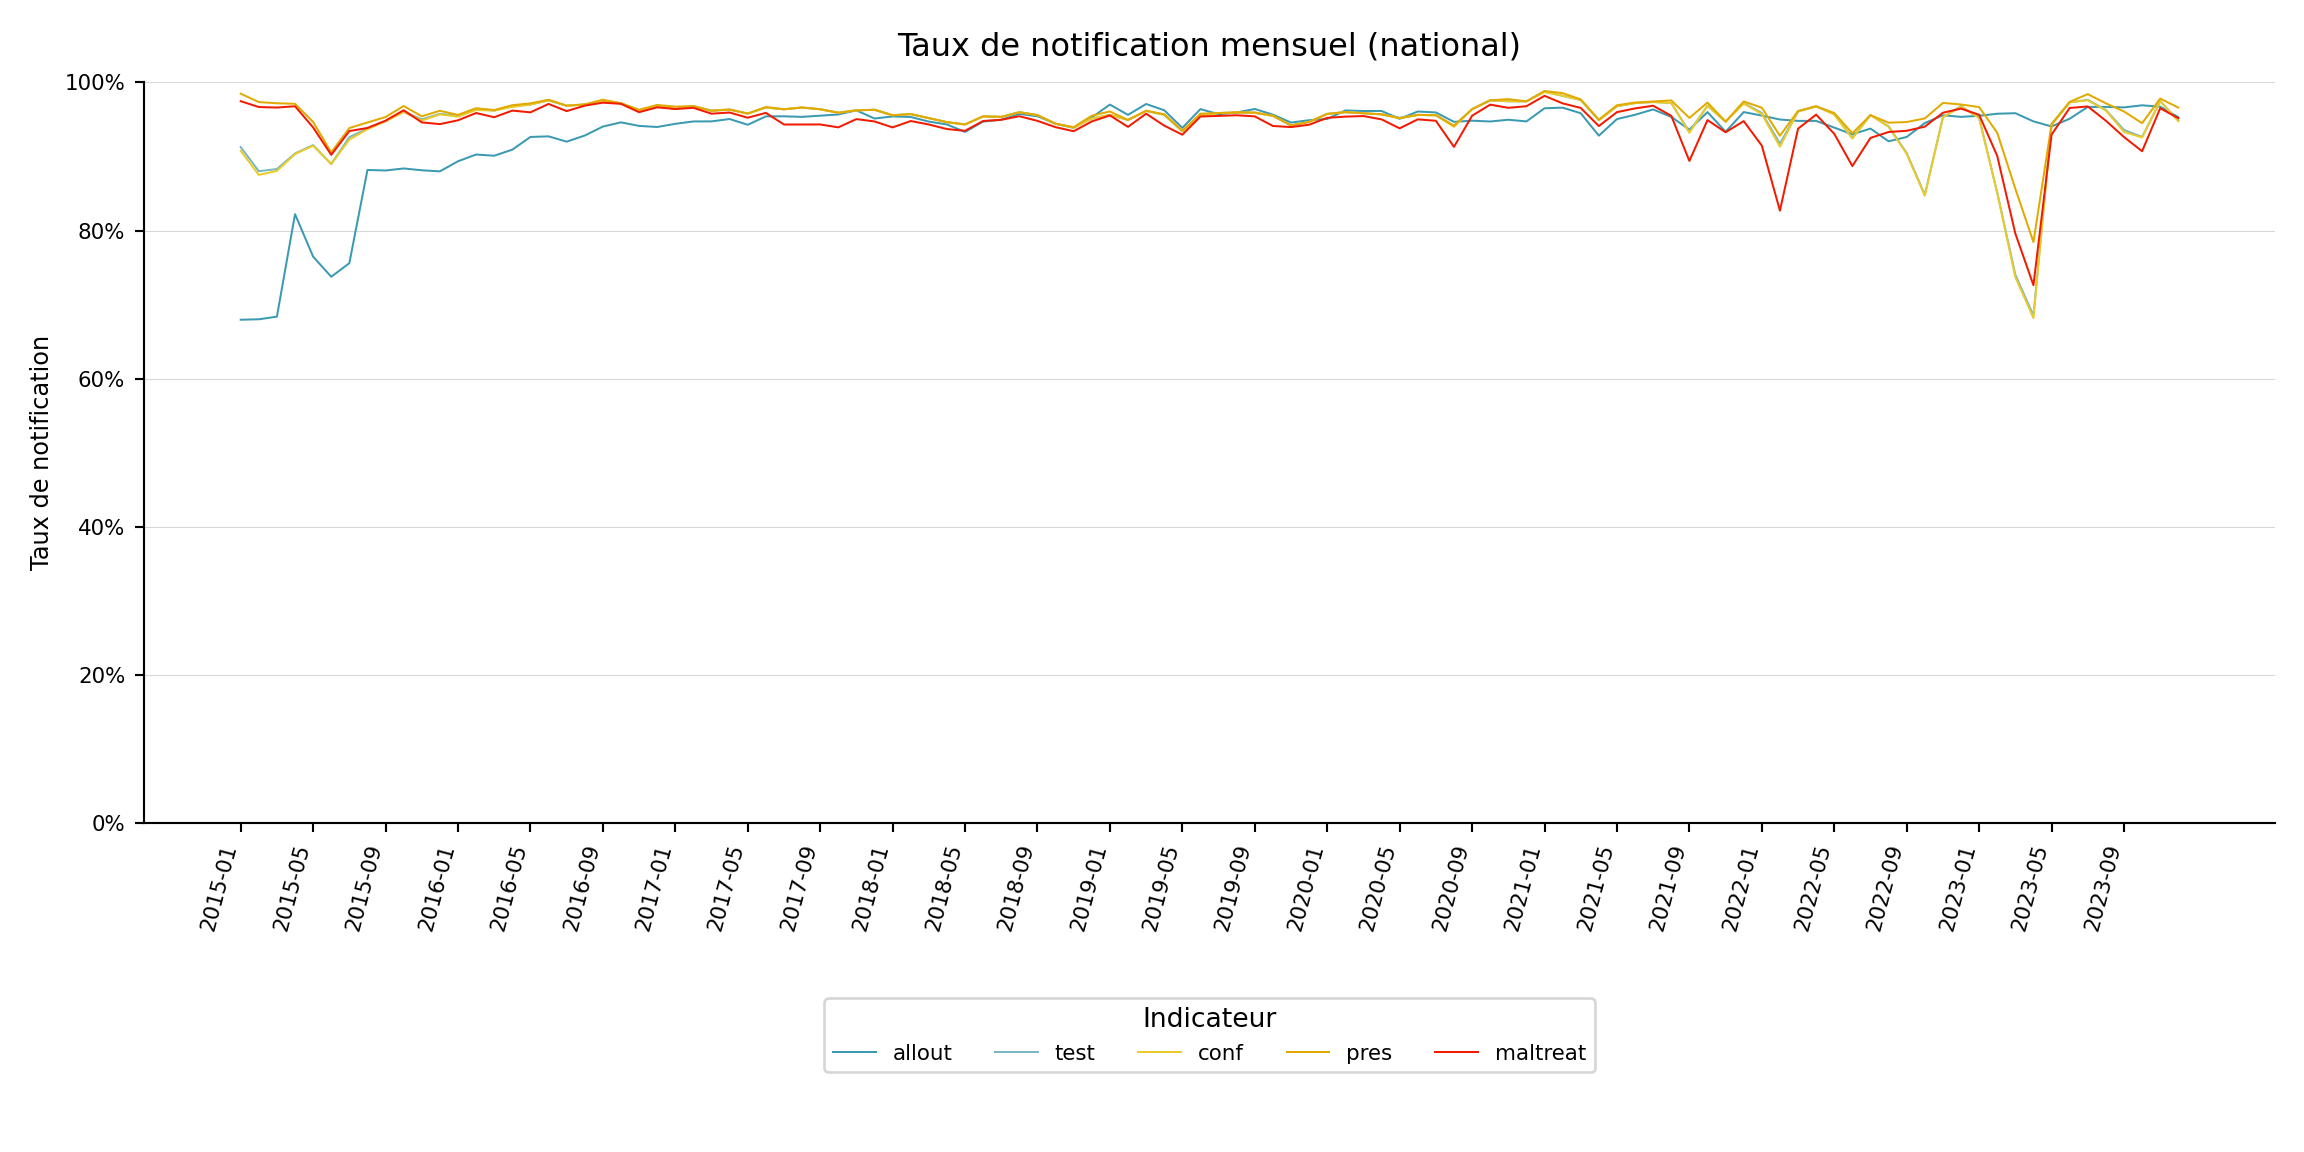
Pour adapter le code :
- Ne rien modifier dans le code ci-dessus.
Étape 6 : Visualiser les taux de notification par unité administrative
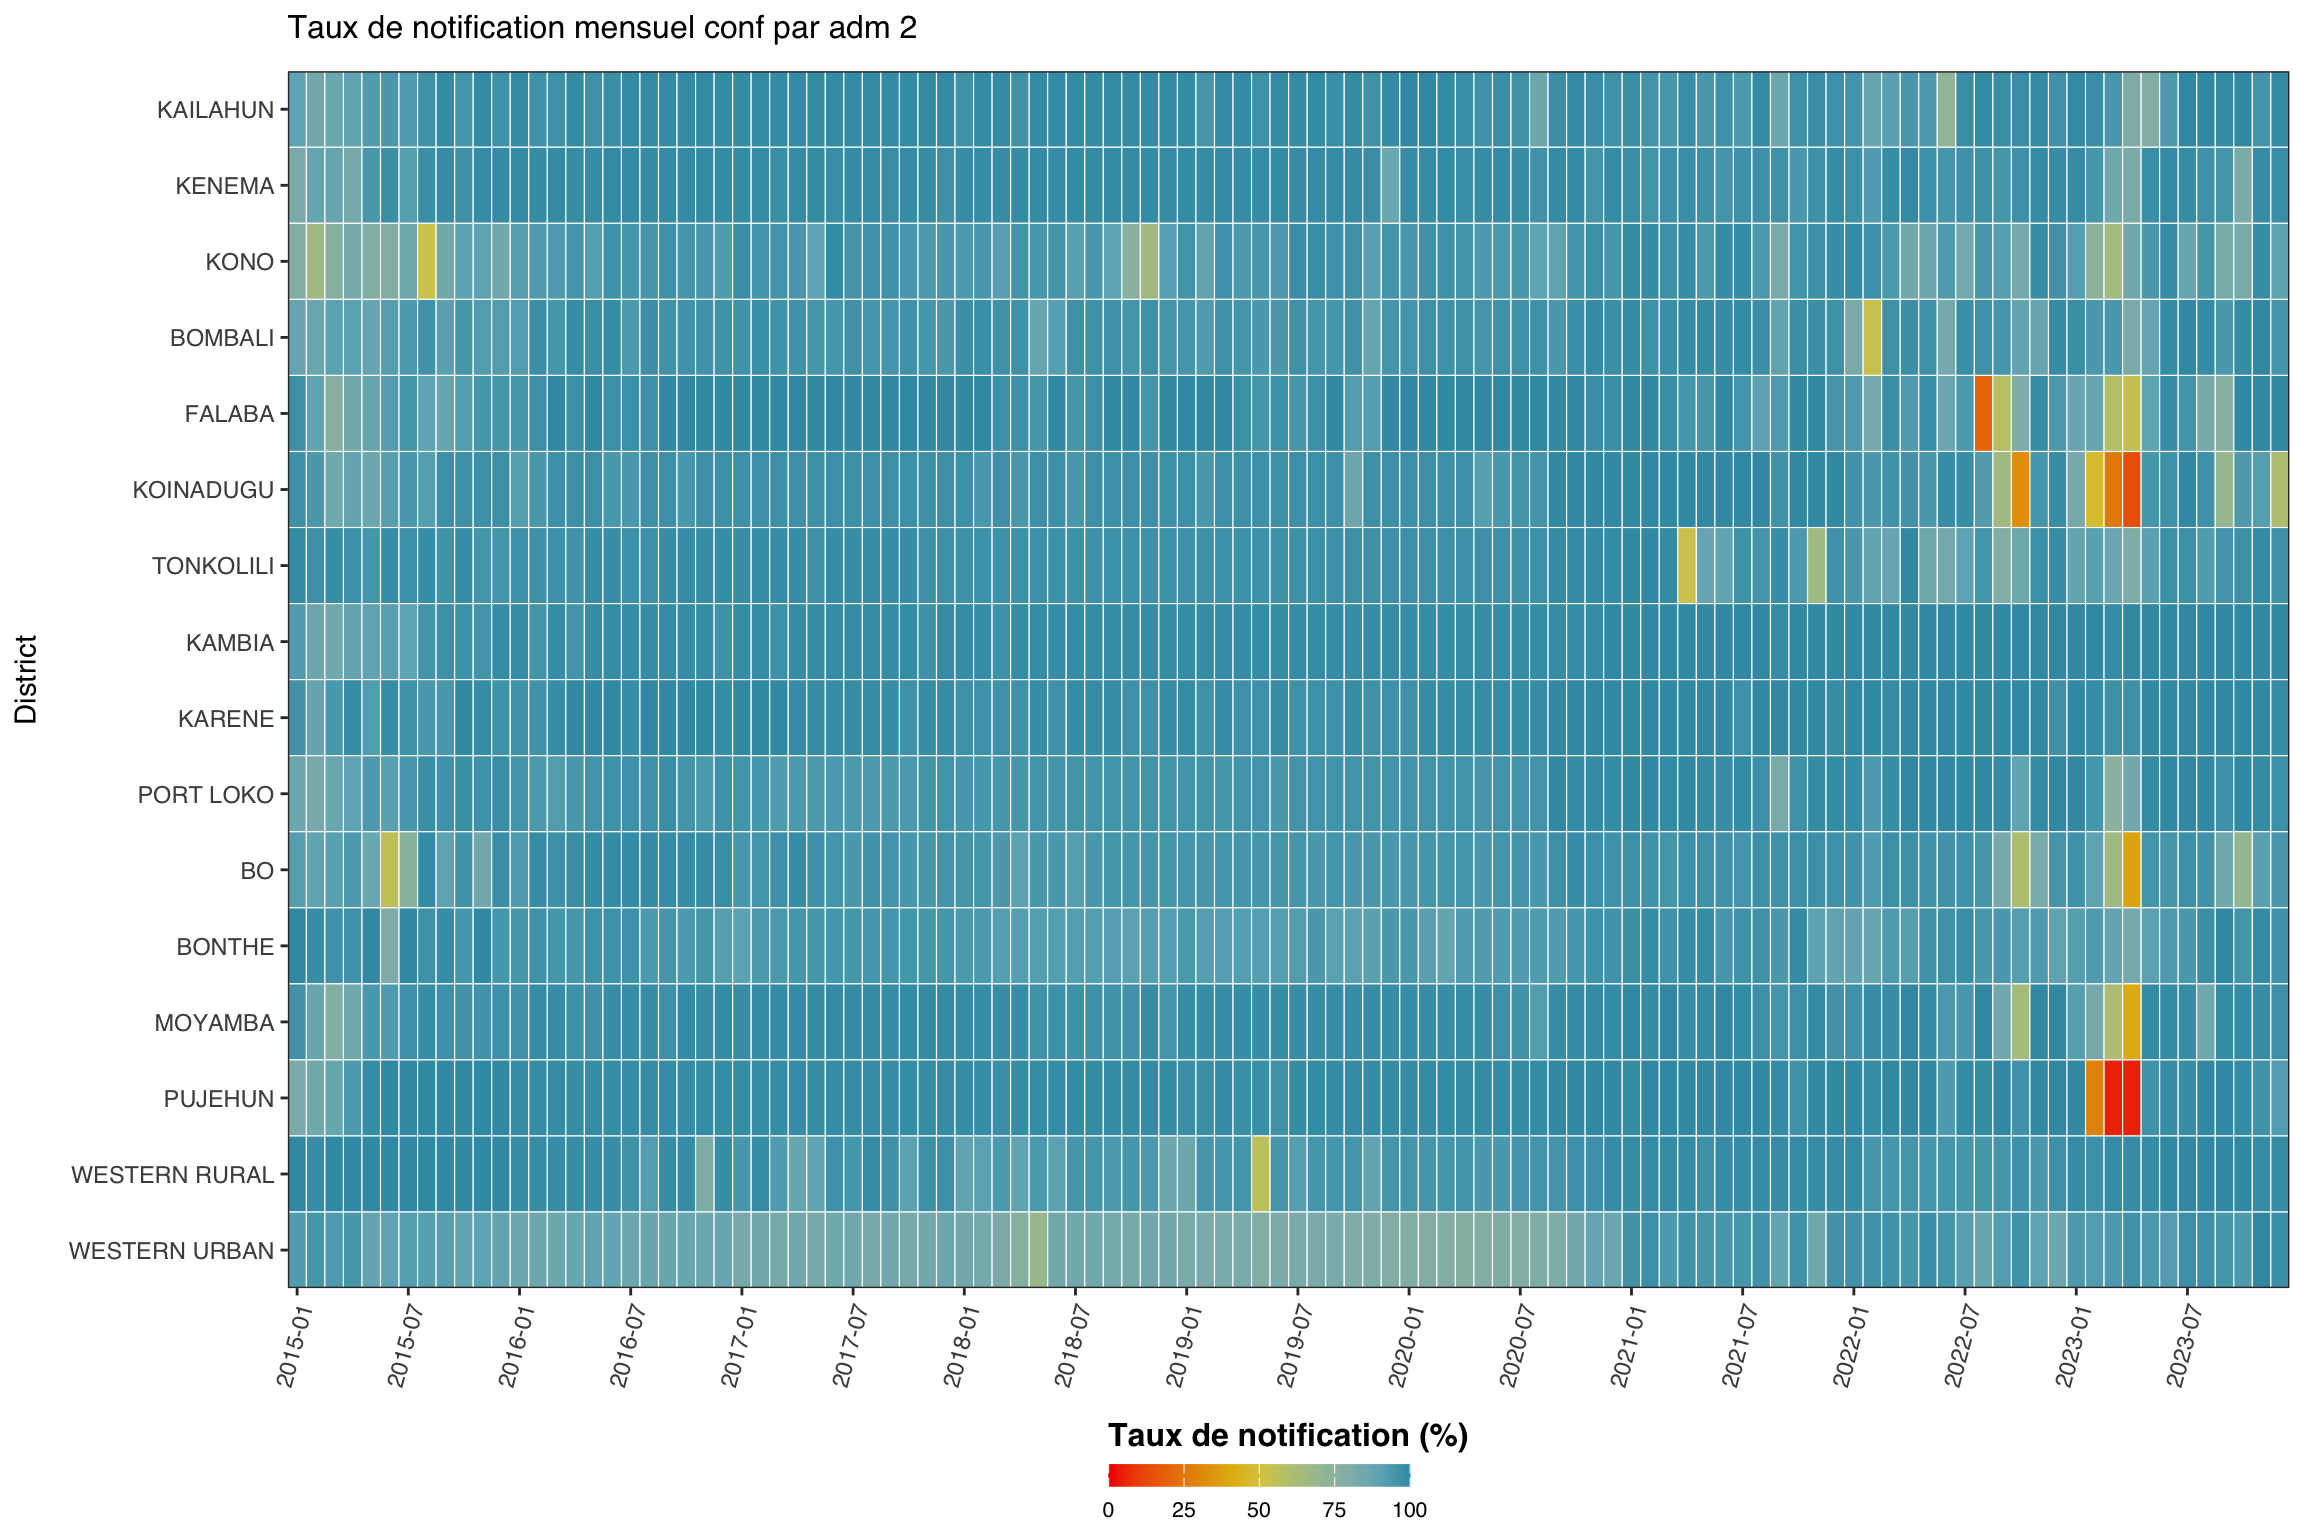
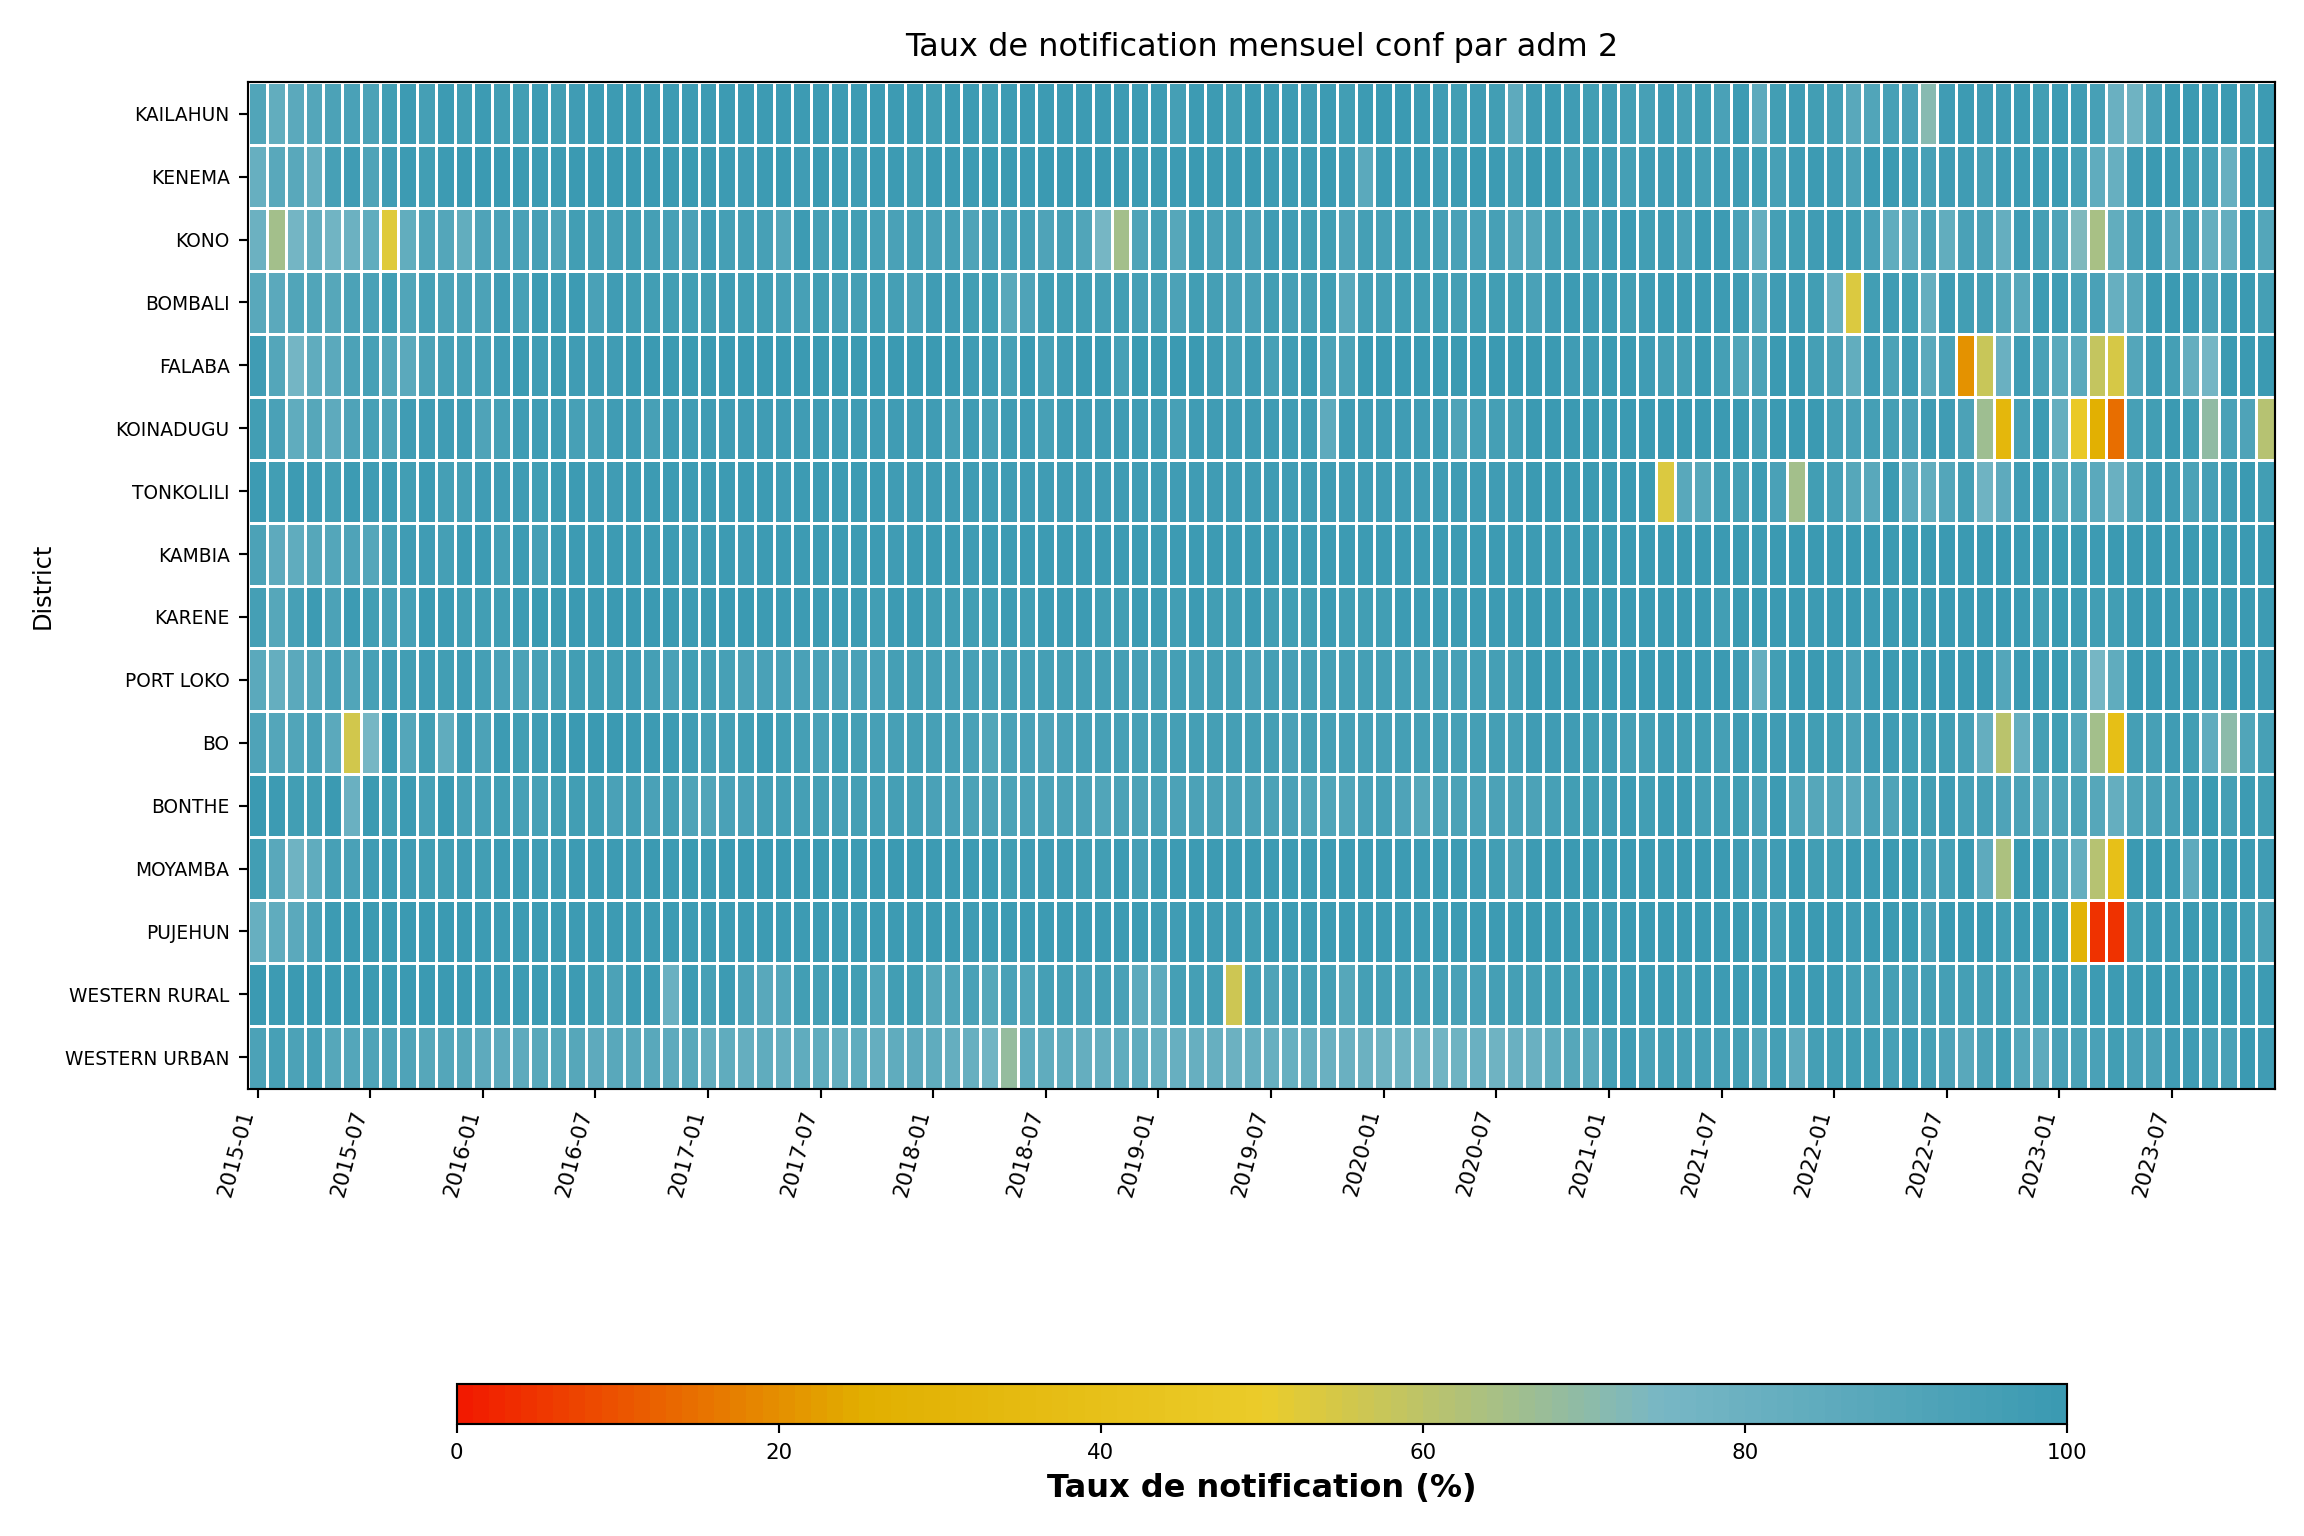
Étape 6.1 : Carte thermique à indicateur unique par unité administrative
Nous nous concentrons maintenant sur un indicateur (conf) et désagrégeons par unité administrative (adm2), regroupée par adm1. La carte thermique montre le temps sur l’axe x et l’unité administrative sur l’axe y.
Afficher le code
indicator <- "conf"
level <- 2
group_lvl <- 1 # regrouper les lignes par ce niveau admin supérieur
# calculer et convertir en %
df_admin <- compute_rep_rate(panel_df, level, indicator) |>
dplyr::mutate(rr_pct = reprate * 100)
# attacher la colonne admin de regroupement
tree <- dhis2_df |>
dplyr::select(
dplyr::all_of(c(paste0("adm", level), paste0("adm", group_lvl)))
) |>
dplyr::distinct()
df_admin <- df_admin |>
dplyr::left_join(tree, by = paste0("adm", level)) |>
dplyr::arrange(
.data[[paste0("adm", group_lvl)]],
.data[[paste0("adm", level)]]
)
# classer les unités admin par groupe puis alphabétiquement
adm_order <- df_admin |>
dplyr::distinct(
dplyr::across(dplyr::all_of(
c(paste0("adm", group_lvl), paste0("adm", level))
))
) |>
dplyr::pull(paste0("adm", level))
yearmon_levels <- sort(unique(df_admin$yearmon))
x_breaks <- yearmon_levels[seq(1, length(yearmon_levels), by = 6)]
ggplot2::ggplot(
df_admin,
ggplot2::aes(
x = yearmon,
y = forcats::fct_relevel(.data[[paste0("adm", level)]], rev(adm_order)),
fill = rr_pct
)
) +
ggplot2::geom_tile(colour = "white", linewidth = .2) +
ggplot2::scale_fill_gradientn(
colours = rev(wesanderson::wes_palette(
"Zissou1", 100, type = "continuous"
)),
limits = c(0, 100),
na.value = "grey85"
) +
ggplot2::guides(
fill = ggplot2::guide_colorbar(
title.position = "top",
nrow = 1,
label.position = "bottom",
direction = "horizontal",
barheight = ggplot2::unit(0.3, "cm"),
barwidth = ggplot2::unit(4, "cm"),
ticks = TRUE,
draw.ulim = TRUE,
draw.llim = TRUE
)
) +
ggplot2::scale_x_discrete(breaks = x_breaks, expand = c(0, 0)) +
ggplot2::scale_y_discrete(expand = c(0, 0)) +
ggplot2::labs(
fill = "Taux de notification (%)",
x = NULL,
y = "District",
title = paste("Taux de notification mensuel", indicator, "par adm", level)
) +
ggplot2::theme_bw() +
ggplot2::theme(
legend.title = ggplot2::element_text(
size = 12,
face = "bold",
family = "sans"
),
legend.position = "bottom",
legend.direction = "horizontal",
legend.box = "horizontal",
legend.box.just = "center",
legend.margin = ggplot2::margin(t = 0, unit = "cm"),
legend.text = ggplot2::element_text(
size = 8,
family = "sans"
),
axis.title.x = ggplot2::element_text(
margin = ggplot2::margin(t = 5, unit = "pt")
),
axis.title.y = ggplot2::element_text(
margin = ggplot2::margin(r = 10, unit = "pt")
),
axis.text.x = ggplot2::element_text(
angle = 75,
hjust = 1,
family = "sans"
),
axis.text = ggplot2::element_text(family = "sans"),
axis.title = ggplot2::element_text(family = "sans"),
plot.title = ggtext::element_markdown(
size = 12,
family = "sans",
margin = ggplot2::margin(b = 10)
),
panel.grid.minor = ggplot2::element_blank(),
panel.grid.major = ggplot2::element_blank(),
panel.background = ggplot2::element_blank()
)
NoteSortie
Pour adapter le code :
- Ligne 1 : Modifier
indicatorpour se concentrer sur un indicateur différent. - Ligne 2 : Ajuster
levelpour tracer à un niveau admin différent. - Ligne 3 : Ajuster
group_lvlpour regrouper les lignes par un niveau admin supérieur différent.
Afficher le code
import matplotlib.colors as mcolors
import matplotlib.pyplot as plt
import numpy as np
import pandas as pd
indicator_h = "conf"
level_h = 2
group_lvl_h = 1
# calculer le taux de notification et convertir en %
df_admin = compute_rep_rate(panel_df, level_h, indicator_h).assign(
rr_pct=lambda d: d["reprate"] * 100
)
# attacher la colonne admin de regroupement
tree = (
dhis2_df[[f"adm{level_h}", f"adm{group_lvl_h}"]]
.drop_duplicates()
)
df_admin = (
df_admin
.merge(tree, on=f"adm{level_h}", how="left")
.sort_values([f"adm{group_lvl_h}", f"adm{level_h}"])
)
# ordre adm : trié par groupe puis alphabétiquement au sein du groupe
adm_order = (
df_admin[[f"adm{group_lvl_h}", f"adm{level_h}"]]
.drop_duplicates()
.sort_values([f"adm{group_lvl_h}", f"adm{level_h}"])
[f"adm{level_h}"]
.tolist()
)
yearmon_levels_h = sorted(df_admin["yearmon"].unique())
# un mois sur six sur l'axe x
x_breaks_h = yearmon_levels_h[::6]
# Zissou1 inversée
zissou1_colors = ["#3B9AB2", "#78B7C5", "#EBCC2A", "#E1AF00", "#F21A00"]
zissou1_r_cmap = mcolors.LinearSegmentedColormap.from_list(
"Zissou1", zissou1_colors, N=100
).reversed()
# ordre axe y : premier indicateur en haut (R utilise rev(adm_order))
ind_order_h = list(reversed(adm_order))
pivot_h = (
df_admin
.pivot_table(
index=f"adm{level_h}", columns="yearmon",
values="rr_pct", aggfunc="mean"
)
.reindex(index=ind_order_h, columns=yearmon_levels_h)
)
fig, ax = plt.subplots(figsize=(12, 8))
mesh = ax.pcolormesh(
np.arange(len(yearmon_levels_h) + 1),
np.arange(len(ind_order_h) + 1),
pivot_h.values,
cmap=zissou1_r_cmap,
vmin=0,
vmax=100,
linewidth=0.5,
edgecolors="white",
antialiased=False,
)
ax.set_aspect("auto")
xtick_pos_h = [yearmon_levels_h.index(ym) + 0.5 for ym in x_breaks_h]
ax.set_xticks(xtick_pos_h)
ax.set_xticklabels(x_breaks_h, rotation=75, ha="right", fontsize=8)
ax.set_yticks(np.arange(len(ind_order_h)) + 0.5)
ax.set_yticklabels(ind_order_h, fontsize=7)
ax.set_xlabel("")
ax.set_ylabel("District", fontsize=9)
ax.set_title(
f"Taux de notification mensuel {indicator_h} par adm {level_h}",
fontsize=12, pad=10,
)
ax.grid(False)
cbar = fig.colorbar(
mesh, ax=ax, orientation="horizontal",
fraction=0.03, pad=0.22, aspect=40,
)
cbar.set_label("Taux de notification (%)", fontsize=12, fontweight="bold")
cbar.ax.tick_params(labelsize=8)
plt.tight_layout()
NoteSortie
Pour adapter le code :
- Ligne 6 : Modifier
indicator_hpour se concentrer sur un indicateur différent. - Ligne 7 : Ajuster
level_hpour tracer à un niveau admin différent. - Ligne 8 : Ajuster
group_lvl_hpour regrouper les lignes par un niveau admin supérieur différent.
Étape 6.2 : Graphique linéaire à indicateur unique par unité administrative
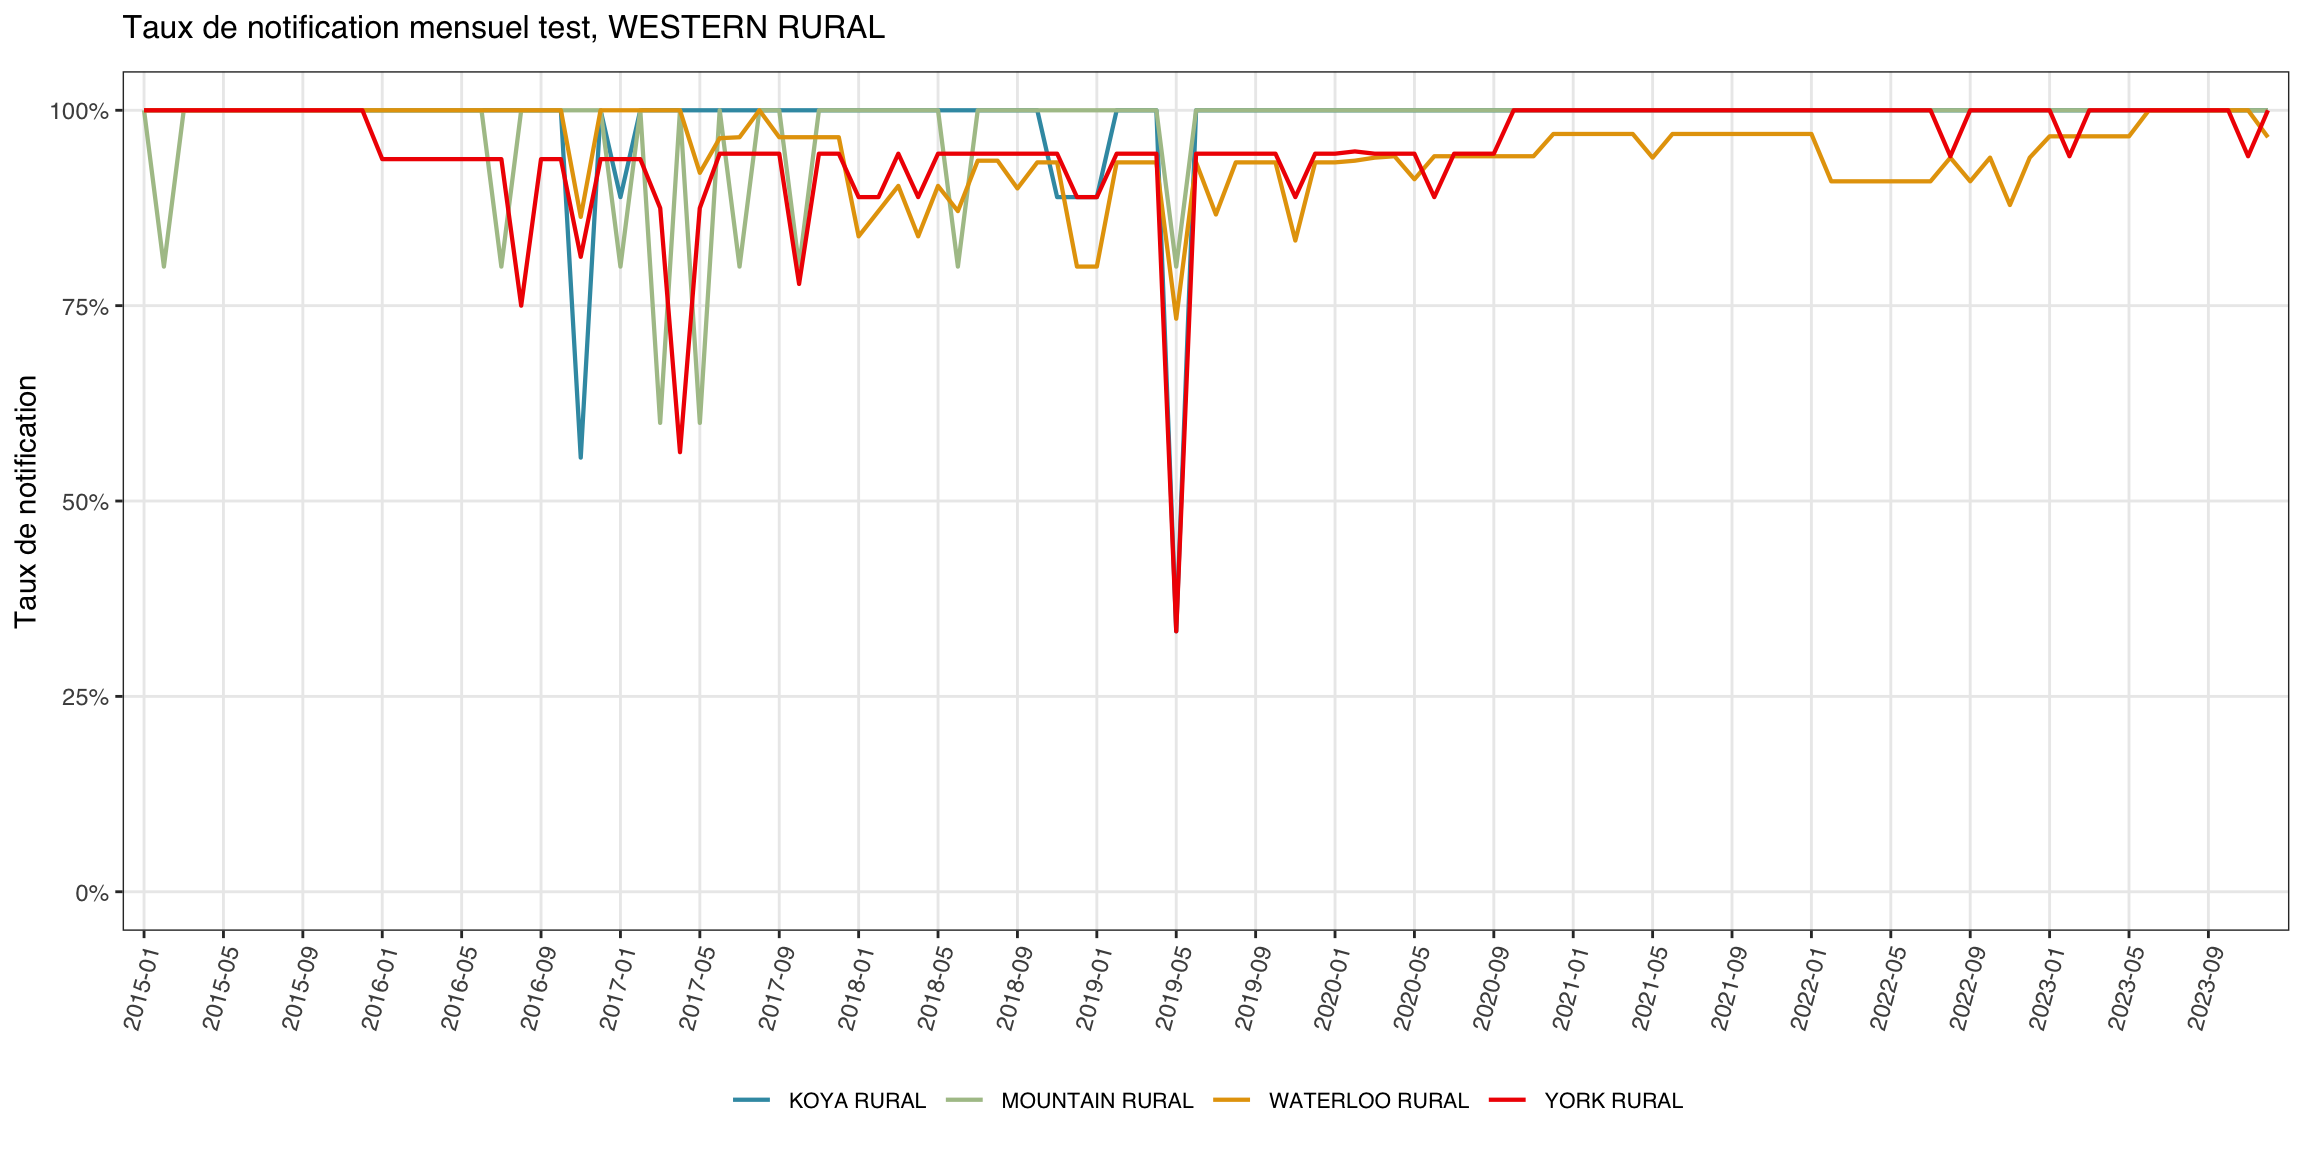
Le graphique linéaire est utile quand l’attention se porte sur une unité admin parente et ses enfants, par exemple un district (adm2) et ses chefferies (adm3).
Afficher le code
indicator <- "test"
level <- 3
target_adm2 <- "WESTERN RURAL"
df_line <- compute_rep_rate(panel_df, level, indicator)
tree <- dhis2_df |>
dplyr::select(adm2, dplyr::all_of(paste0("adm", level))) |>
dplyr::distinct()
df_line <- df_line |>
dplyr::left_join(tree, by = paste0("adm", level)) |>
dplyr::filter(adm2 == target_adm2)
yearmon_levels <- sort(unique(df_line$yearmon))
x_breaks <- yearmon_levels[seq(1, length(yearmon_levels), by = 4)]
n_adm <- dplyr::n_distinct(df_line[[paste0("adm", level)]])
ggplot2::ggplot(
df_line,
ggplot2::aes(
x = yearmon,
y = reprate,
color = .data[[paste0("adm", level)]],
group = .data[[paste0("adm", level)]]
)
) +
ggplot2::geom_line(linewidth = 0.75) +
ggplot2::scale_color_manual(
values = wesanderson::wes_palette("Zissou1", n_adm,
type = "continuous")
) +
ggplot2::scale_x_discrete(breaks = x_breaks, expand = c(0.01, 0.01)) +
ggplot2::scale_y_continuous(labels = scales::percent_format(accuracy = 1)) +
ggplot2::coord_cartesian(ylim = c(0, 1)) +
ggplot2::labs(
x = NULL,
y = "Taux de notification",
title = paste0("Taux de notification mensuel ", indicator, ", ", target_adm2),
color = NULL
) +
ggplot2::theme_bw() +
ggplot2::theme(
legend.position = "bottom",
legend.text = ggplot2::element_text(size = 8, family = "sans"),
axis.text.x = ggplot2::element_text(
angle = 75, hjust = 1, family = "sans"
),
axis.text = ggplot2::element_text(family = "sans"),
axis.title = ggplot2::element_text(family = "sans"),
plot.title = ggtext::element_markdown(
size = 12, family = "sans",
margin = ggplot2::margin(b = 10)
),
panel.grid.minor = ggplot2::element_blank()
)
NoteSortie
Pour adapter le code :
- Ligne 1 : Modifier
indicatorpour se concentrer sur un indicateur différent. - Ligne 3 : Modifier
target_adm2pour un autre nom de district.
Afficher le code
import matplotlib.colors as mcolors
import matplotlib.pyplot as plt
import numpy as np
indicator_l = "test"
level_l = 3
target_adm2_l = "WESTERN RURAL"
df_line = compute_rep_rate(panel_df, level_l, indicator_l)
# attacher adm2 pour filtrer
tree_l = (
dhis2_df[["adm2", f"adm{level_l}"]]
.drop_duplicates()
)
df_line = (
df_line
.merge(tree_l, on=f"adm{level_l}", how="left")
.loc[lambda d: d["adm2"] == target_adm2_l]
)
yearmon_levels_l = sorted(df_line["yearmon"].unique())
x_breaks_l = yearmon_levels_l[::4]
n_adm_l = df_line[f"adm{level_l}"].nunique()
# Zissou1 échantillonnée à n_adm_l positions
zissou1_lc = mcolors.LinearSegmentedColormap.from_list(
"Zissou1", ["#3B9AB2", "#78B7C5", "#EBCC2A", "#E1AF00", "#F21A00"], N=100
)
line_colors_l = [
zissou1_lc(i / max(n_adm_l - 1, 1)) for i in range(n_adm_l)
]
adm3_list = sorted(df_line[f"adm{level_l}"].unique())
fig, ax = plt.subplots(figsize=(12, 6))
for idx, adm_val in enumerate(adm3_list):
sub = (
df_line.loc[df_line[f"adm{level_l}"] == adm_val]
.sort_values("yearmon")
)
ax.plot(
sub["yearmon"],
sub["reprate"],
linewidth=0.75,
color=line_colors_l[idx],
label=adm_val,
)
ax.set_xticks(
[yearmon_levels_l.index(ym) for ym in x_breaks_l]
)
ax.set_xticklabels(x_breaks_l, rotation=75, ha="right", fontsize=8)
ax.yaxis.set_major_formatter(mticker.PercentFormatter(xmax=1, decimals=0))
ax.set_ylim(0, 1)
ax.set_xlabel("")
ax.set_ylabel("Taux de notification", fontsize=9)
ax.set_title(
f"Taux de notification mensuel {indicator_l}, {target_adm2_l}",
fontsize=12, pad=10,
)
ax.tick_params(labelsize=8)
ax.legend(fontsize=7, loc="lower center",
ncol=min(n_adm_l, 6), bbox_to_anchor=(0.5, -0.40))
ax.grid(axis="y", linewidth=0.4, alpha=0.5)
ax.grid(axis="x", visible=False)
for spine in ["top", "right"]:
ax.spines[spine].set_visible(False)
plt.tight_layout()
NoteSortie
(0.0, 1.0)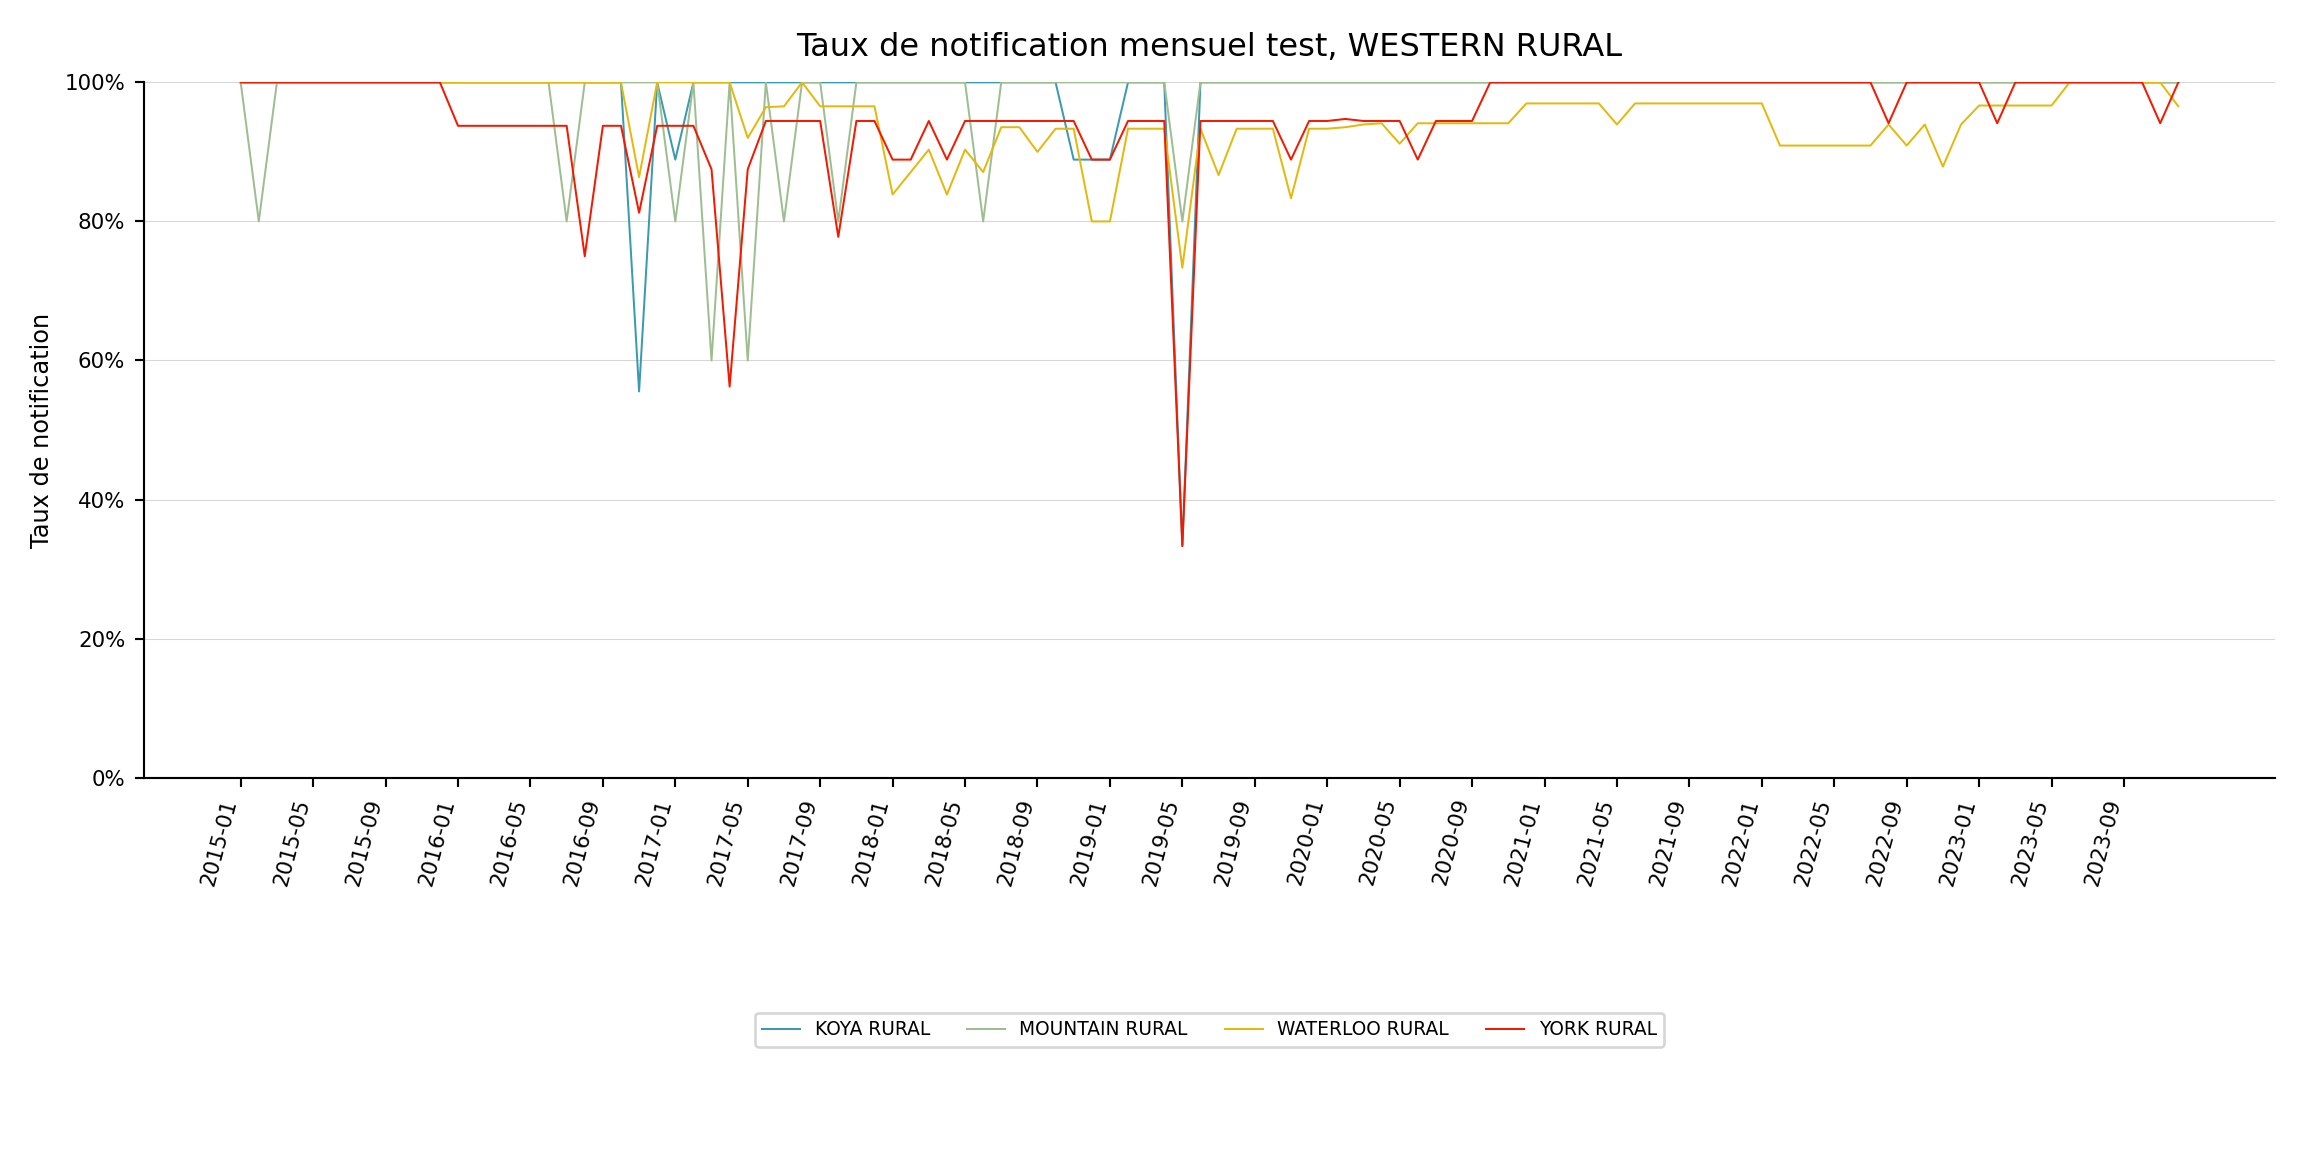
Pour adapter le code :
- Ligne 5 : Modifier
indicator_lpour se concentrer sur un indicateur différent. - Ligne 7 : Modifier
target_adm2_lpour un autre nom de district.
Étape 6.3 : Carte choroplèthe à indicateur unique par unité administrative
La carte thermique et le graphique linéaire ancrent un axe sur le temps. La carte transforme le temps en petits multiples en facettes et utilise la géographie comme axe y, ce qui facilite l’identification des zones du pays qui tirent le taux vers le bas. Nous agrégeons les moyennes annuelles par adm2, les joignons au shapefile adm2 et produisons un choroplèthe par année.
Afficher le code
indicator <- "conf"
# charger l'objet spatial adm2 traité
adm2_sf <- readRDS(here::here(
"01_data",
"1.1_foundational",
"1.1a_admin_boundaries",
"processed",
"sle_spatial_adm2_2021.rds"
)) |>
sf::st_as_sf()
# taux de notification annuel moyen par adm2 pour l'indicateur choisi
df_map <- compute_rep_rate(panel_df, 2, indicator) |>
dplyr::mutate(year = substr(yearmon, 1, 4)) |>
dplyr::group_by(adm2, year) |>
dplyr::summarise(
rr_pct = base::mean(reprate, na.rm = TRUE) * 100,
.groups = "drop"
)
# borne inférieure de l'échelle de couleurs : plancher du plus petit
# taux annuel observé. remplacer par une valeur fixe (ex. 0 ou 50)
# pour ancrer la légende sur une plage constante entre les rendus.
fill_min <- floor(min(df_map$rr_pct, na.rm = TRUE))
# attacher le taux de notification aux polygones
df_map_sf <- adm2_sf |>
dplyr::left_join(df_map, by = "adm2")
ggplot2::ggplot(df_map_sf) +
ggplot2::geom_sf(
ggplot2::aes(fill = rr_pct),
colour = "white", linewidth = .2
) +
ggplot2::scale_fill_gradientn(
colours = rev(wesanderson::wes_palette(
"Zissou1", 100, type = "continuous"
)),
limits = c(fill_min, 100),
na.value = "grey90",
name = "Taux de notification (%)"
) +
ggplot2::guides(
fill = ggplot2::guide_colorbar(
title.position = "top",
nrow = 1,
label.position = "bottom",
direction = "horizontal",
barheight = ggplot2::unit(0.3, "cm"),
barwidth = ggplot2::unit(4, "cm"),
ticks = TRUE,
draw.ulim = TRUE,
draw.llim = TRUE
)
) +
ggplot2::facet_wrap(~ year, nrow = 3) +
ggplot2::labs(
title = paste0(
"Taux de notification annuel ", indicator, " par adm2"
)
) +
ggplot2::theme_bw() +
ggplot2::theme(
legend.title = ggplot2::element_text(
size = 12, face = "bold", family = "sans"
),
legend.position = "bottom",
legend.direction = "horizontal",
legend.box = "horizontal",
legend.box.just = "center",
legend.margin = ggplot2::margin(t = 0, unit = "cm"),
legend.text = ggplot2::element_text(size = 8, family = "sans"),
axis.text = ggplot2::element_blank(),
axis.title = ggplot2::element_blank(),
axis.ticks = ggplot2::element_blank(),
panel.grid.minor = ggplot2::element_blank(),
panel.grid.major = ggplot2::element_blank(),
panel.background = ggplot2::element_blank(),
strip.text = ggplot2::element_text(family = "sans", face = "bold"),
strip.background = ggplot2::element_blank(),
plot.title = ggtext::element_markdown(
size = 12, family = "sans",
margin = ggplot2::margin(b = 10)
)
)
NoteSortie
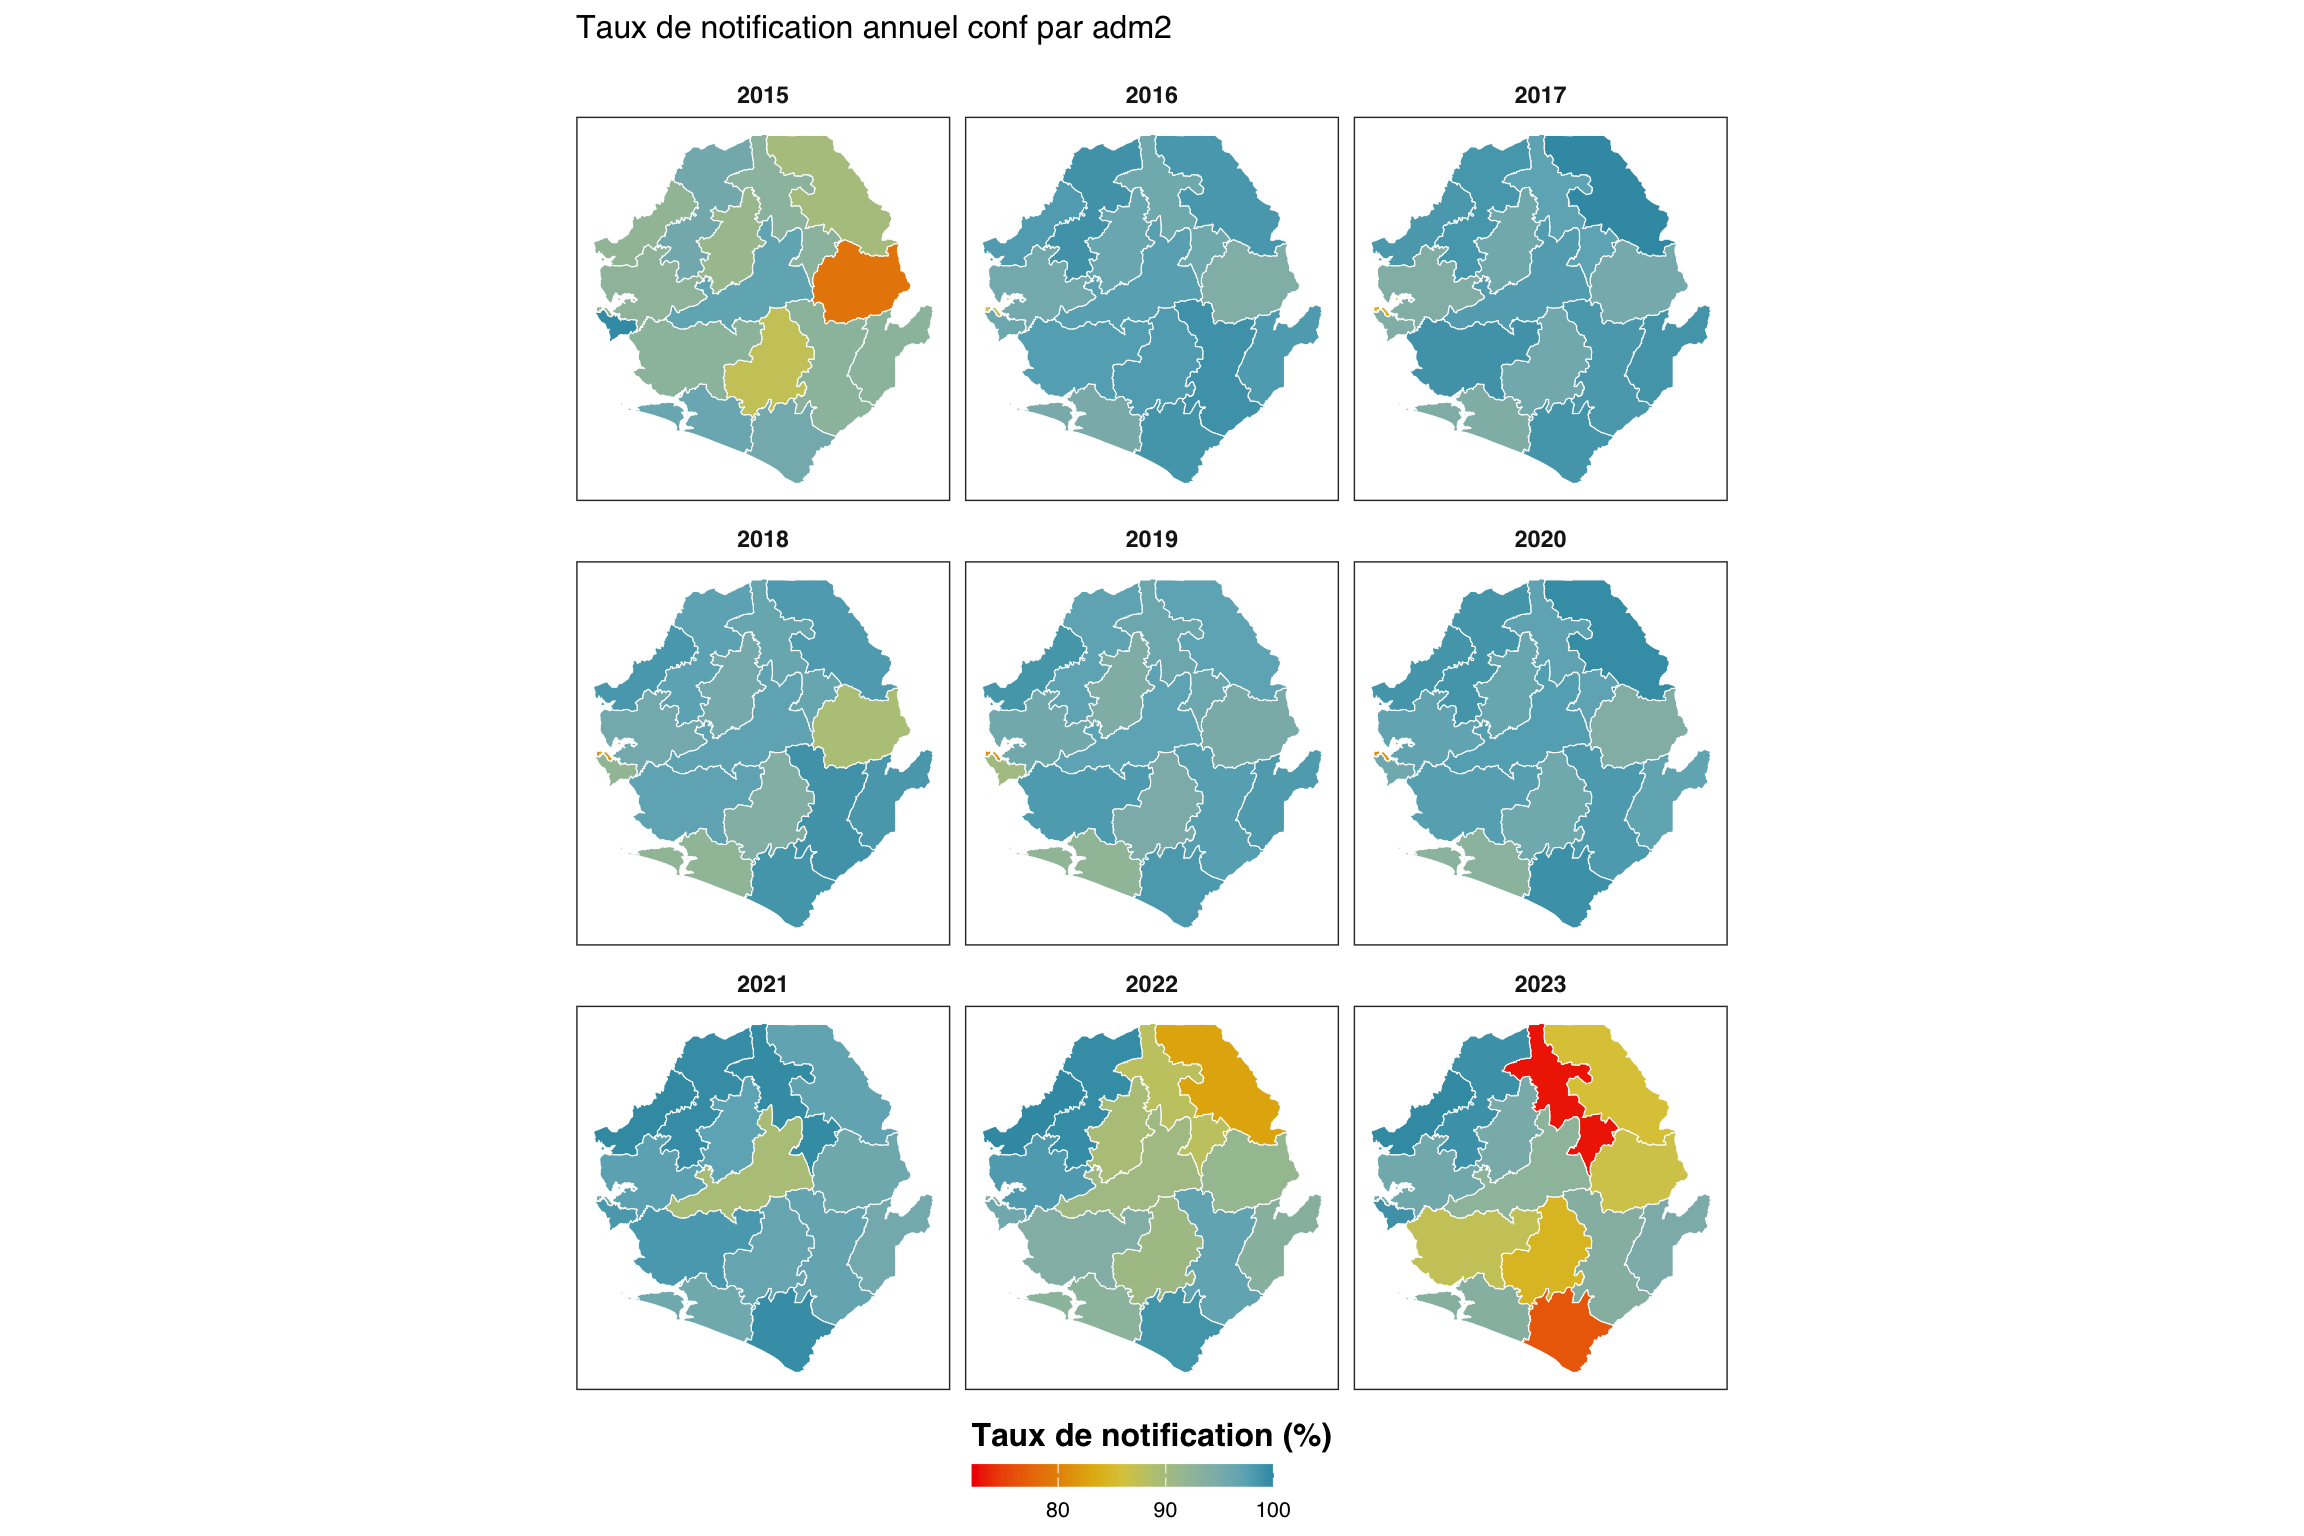
Pour adapter le code :
- Ligne 1 : Modifier
indicatorpour cartographier un indicateur différent. - Lignes 4–9 : Mettre à jour le chemin du shapefile si les fichiers spatiaux
adm2traités se trouvent ailleurs. - Ligne 26 : Définir
fill_minmanuellement (ex.fill_min <- 0oufill_min <- 50) pour ancrer la légende sur une plage constante entre les rendus plutôt que de l’adapter au minimum des données.
Afficher le code
import math
from pathlib import Path
import geopandas as gpd
import matplotlib.colors as mcolors
import matplotlib.pyplot as plt
import numpy as np
import pandas as pd
from pyprojroot import here
indicator_m = "conf"
# charger l'objet spatial adm2 traité (GeoJSON associé au .rds)
adm2_gdf = gpd.read_file(Path(here(
"01_data/1.1_foundational/1.1a_admin_boundaries/processed"
"/sle_spatial_adm2_2021.geojson"
)))
if adm2_gdf.crs is None:
adm2_gdf = adm2_gdf.set_crs("EPSG:4326")
# taux de notification annuel moyen par adm2
df_map = (
compute_rep_rate(panel_df, 2, indicator_m)
.assign(year=lambda d: d["yearmon"].str[:4])
.groupby(["adm2", "year"], as_index=False)
.agg(rr_pct=("reprate", lambda x: x.mean() * 100))
)
# fill_min : plancher du plus petit taux annuel observé
fill_min = math.floor(df_map["rr_pct"].min())
# attacher aux polygones (jointure gauche pour chaque polygone-année)
years_m = sorted(df_map["year"].unique())
df_map_gdf = adm2_gdf.merge(df_map, on="adm2", how="left")
# Zissou1 inversée pour le taux de notification (taux élevé = bleu = bon)
zissou1_colors = ["#3B9AB2", "#78B7C5", "#EBCC2A", "#E1AF00", "#F21A00"]
zissou1_r_cmap = mcolors.LinearSegmentedColormap.from_list(
"Zissou1", zissou1_colors, N=100
).reversed()
norm = plt.Normalize(vmin=fill_min, vmax=100)
# disposition en 3 lignes (correspond à ggplot2 facet_wrap(nrow=3))
n_years = len(years_m)
n_cols_m = math.ceil(n_years / 3)
n_rows_m = 3
fig, axes = plt.subplots(
n_rows_m, n_cols_m,
figsize=(12, 8),
squeeze=False,
)
for idx, yr in enumerate(years_m):
row = idx // n_cols_m
col = idx % n_cols_m
ax = axes[row][col]
sub = df_map_gdf.loc[df_map_gdf["year"] == yr]
# fond gris pour les polygones manquants
adm2_gdf.plot(ax=ax, color="grey90", edgecolor="white", linewidth=0.2)
sub.plot(
column="rr_pct",
ax=ax,
cmap=zissou1_r_cmap,
norm=norm,
edgecolor="white",
linewidth=0.2,
missing_kwds={"color": "#EBEBEB"},
)
ax.set_title(yr, fontsize=9, fontweight="bold")
ax.set_axis_off()
# masquer les axes inutilisés
for idx in range(n_years, n_rows_m * n_cols_m):
axes[idx // n_cols_m][idx % n_cols_m].set_visible(False)
# barre de couleurs horizontale en bas (partagée)
sm = plt.cm.ScalarMappable(cmap=zissou1_r_cmap, norm=norm)
sm.set_array([])
cbar = fig.colorbar(
sm, ax=axes, orientation="horizontal",
fraction=0.02, pad=0.02, aspect=50,
shrink=0.5,
)
cbar.set_label("Taux de notification (%)", fontsize=12, fontweight="bold")
cbar.ax.tick_params(labelsize=8)
fig.suptitle(
f"Taux de notification annuel {indicator_m} par adm2",
fontsize=12, y=1.01,
)
plt.tight_layout()
NoteSortie
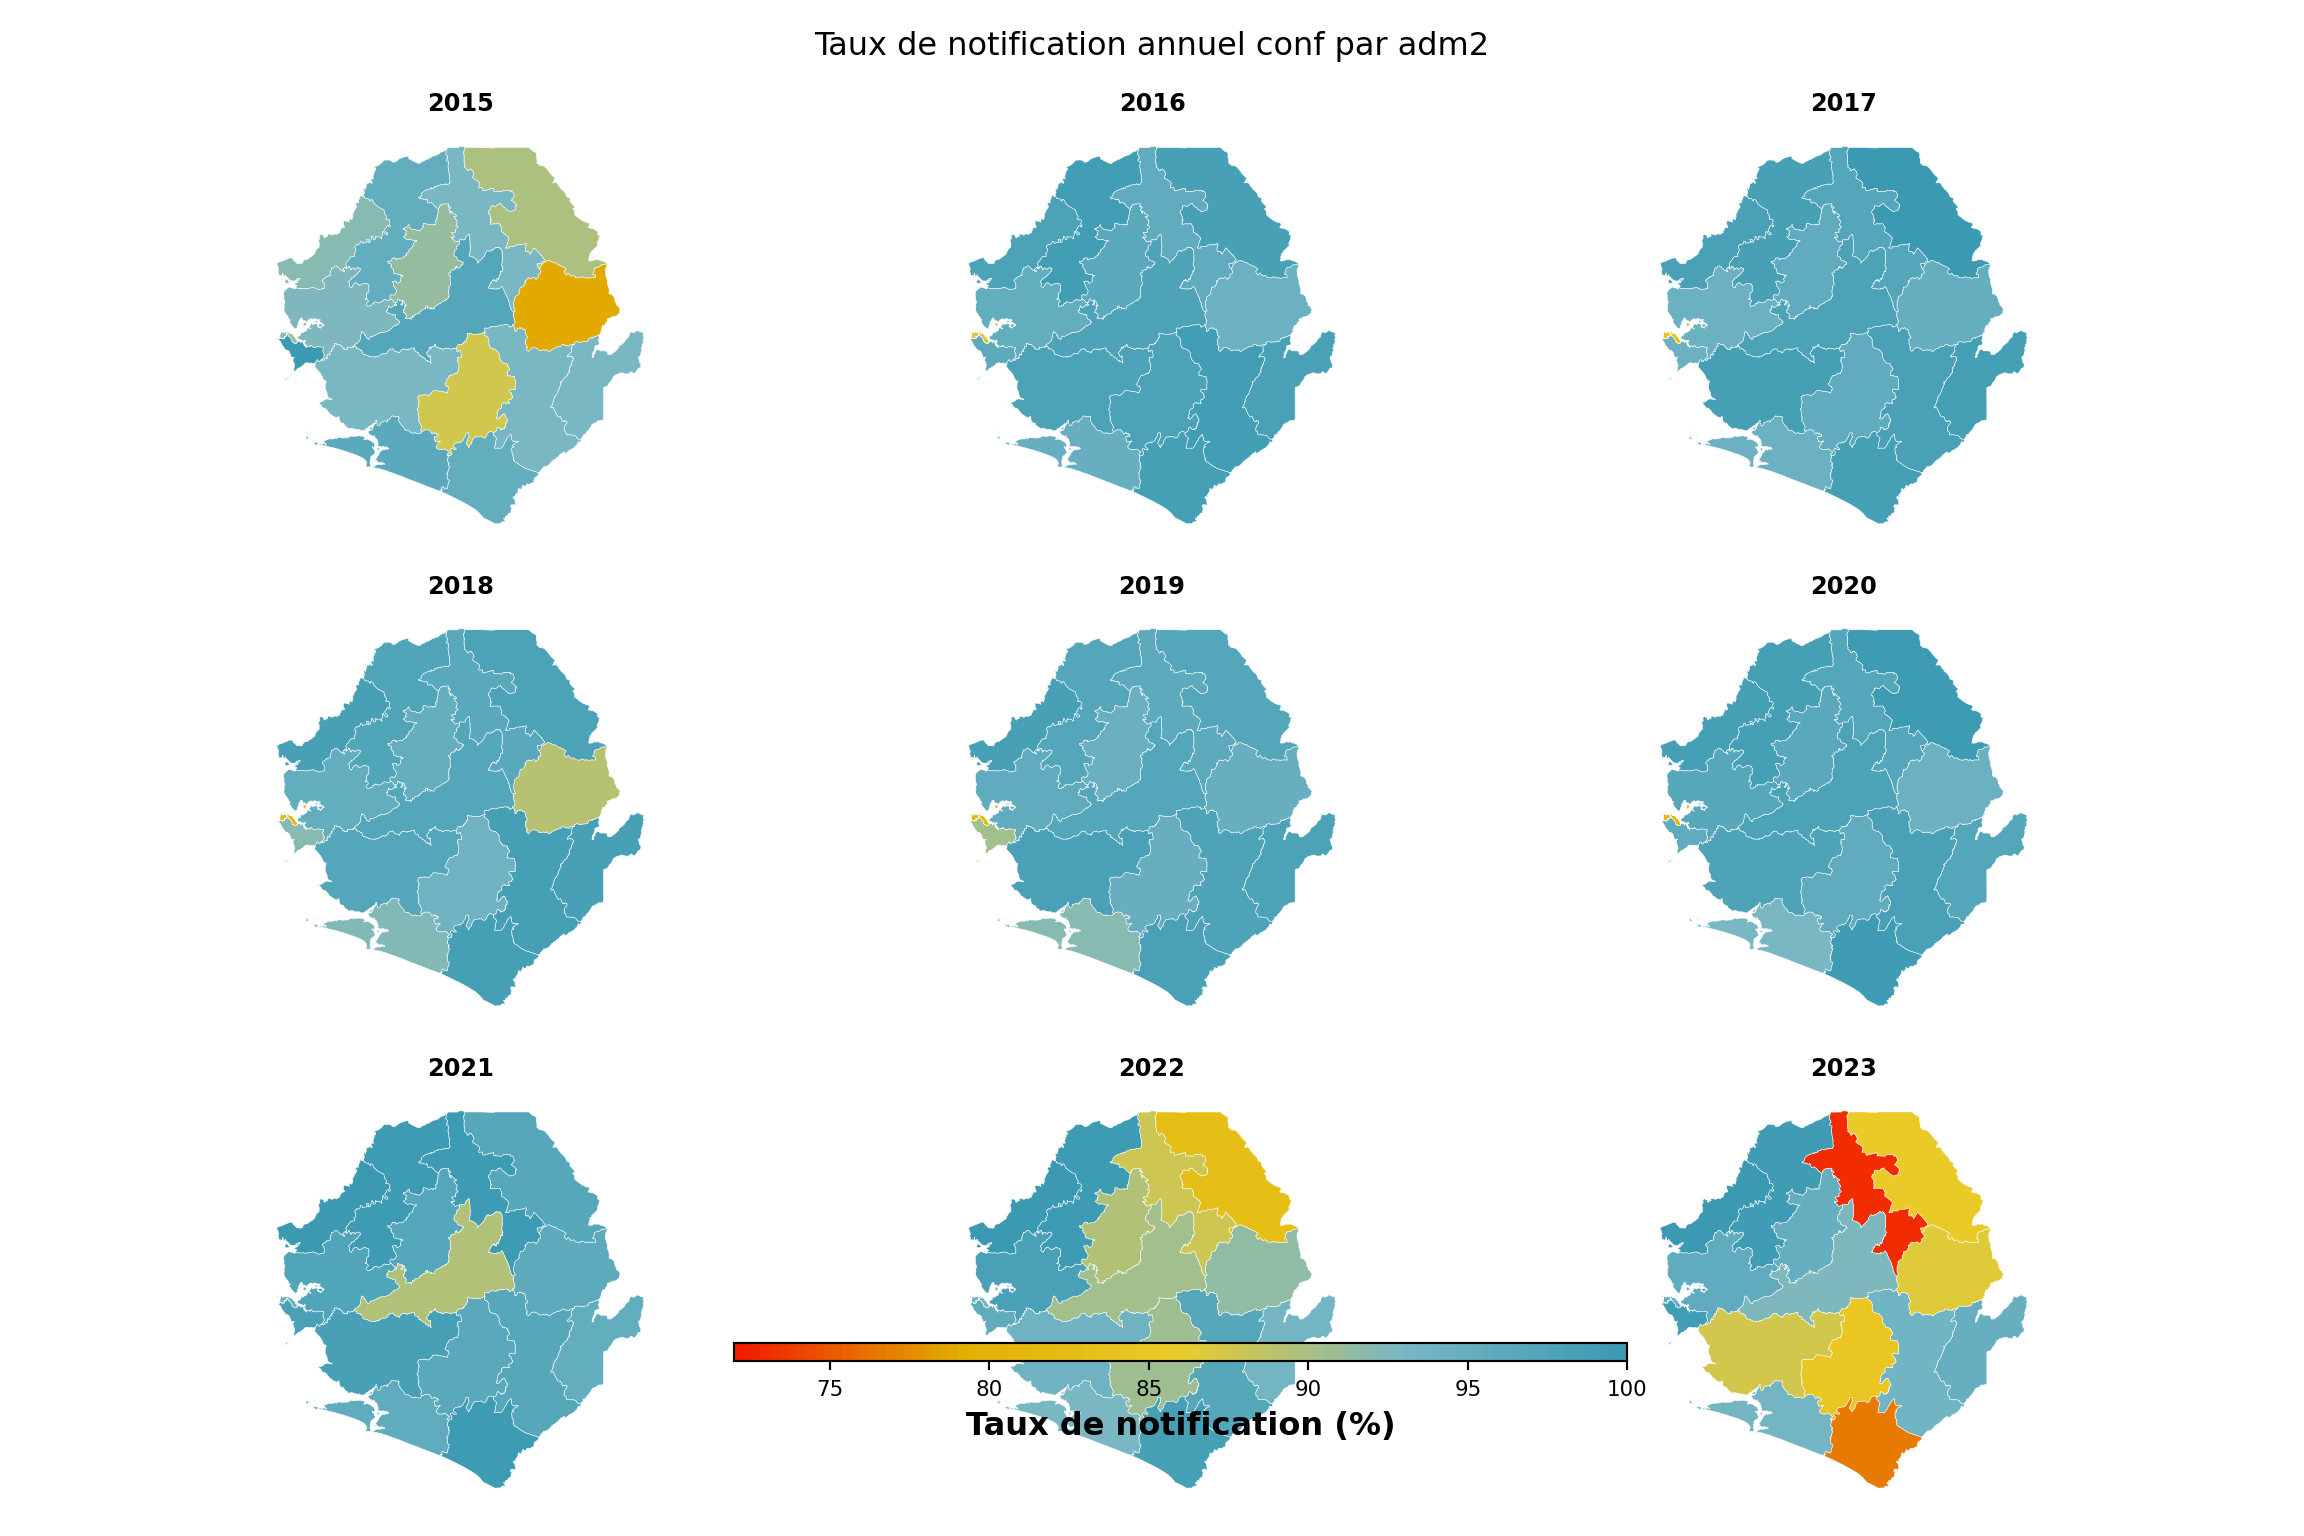
Pour adapter le code :
- Ligne 11 : Modifier
indicator_mpour cartographier un indicateur différent. - Lignes 14–19 : Mettre à jour le chemin du shapefile si les fichiers spatiaux
adm2traités se trouvent ailleurs. - Ligne 30 : Définir
fill_minmanuellement (ex.fill_min = 0oufill_min = 50) pour ancrer la légende sur une plage constante entre les rendus plutôt que de l’adapter au minimum des données.
TipOption de code alternative avec le paquet
sntutils
sntutils::reporting_rate_map() réalise la même opération en un seul appel : classification de l’activité des établissements, calcul du taux de notification et choroplèthe en facettes avec un style cohérent.
Résumé
Cette page a calculé les taux de notification mensuels par indicateur à tout niveau d’unité administrative, non pondérés et pondérés, et a visualisé les résultats selon les indicateurs, les unités admin et le temps. Le taux non pondéré est la bonne mesure pour diagnostiquer la performance de la surveillance ; le taux pondéré est ce que la plupart des corrections de charge nécessitent, car un hôpital de référence manquant représente une charge de cas bien plus importante qu’une clinique périphérique manquante. Comparer les deux révèle si les plus grands contributeurs notifient de manière cohérente. Les résultats validés de cette page alimentent directement la stratification en aval et la deuxième étape de l’ajustement par étapes de l’incidence (\(N_2 = N_1 / R\)).
Code complet
Le script de code complet pour le taux de notification se trouve ci-dessous.
Show full code
################################################################################
######## ~ Taux de notification des établissements de santé full code ~ ########
################################################################################
### Step -----------------------------------------------------------------------
pacman::p_load(
dplyr, # manipulation des données
tidyr, # restructuration des données
purrr, # itération fonctionnelle
lubridate, # gestion des dates
slider, # opérations sur fenêtre mobile pour le taux pondéré
ggplot2, # visualisation des données
ggtext, # texte markdown dans les titres ggplot
wesanderson, # palettes de couleurs (Zissou1)
scales, # formatage des axes
forcats, # ordre des facteurs
stringr, # manipulation des chaînes
tibble, # tableaux de données tidy
knitr, # rendu de tableaux html
cli, # messages informatifs
here # chemins de fichiers reproductibles
)
dhis2_df <- arrow::read_parquet(here::here(
  "01_data",
  "1.2_epidemiology",
  "1.2a_routine_surveillance",
  "processed",
  "clean_malaria_routine_data_final.parquet"
))

dhis2_df <- dhis2_df |>
  dplyr::mutate(
    date = as.Date(date),
    yearmon   = format(date, "%Y-%m")
  )
# paramètres de la méthode 2 : indicateurs signalant la prestation de
# services et la période de grâce (mois) après le dernier rapport d'un
# établissement avant qu'il soit considéré comme inactif
key_indicators <- c("allout", "test", "pres", "conf", "maltreat", "maladm")
nonreport_window <- 6L
# panel équilibré établissements × mois : tout couple manquant est un
# mois sans notification
month_seq <- seq(min(dhis2_df$date), max(dhis2_df$date), by = "month")
panel <- tidyr::expand_grid(
hf_uid = unique(dhis2_df$hf_uid),
date = month_seq
)
panel_df <- dhis2_df |>
dplyr::right_join(panel, by = c("hf_uid", "date")) |>
dplyr::arrange(hf_uid, date) |>
dplyr::group_by(hf_uid) |>
tidyr::fill(adm0, adm1, adm2, adm3, .direction = "downup") |>
dplyr::ungroup() |>
dplyr::mutate(
yearmon = format(date, "%Y-%m"),
reported_any = dplyr::if_any(
dplyr::all_of(key_indicators),
~ !is.na(.x)
)
)
# dates de première / dernière notification et dernière date du panel par établissement
panel_df <- panel_df |>
dplyr::arrange(hf_uid, date) |>
dplyr::group_by(hf_uid) |>
dplyr::mutate(
first_rep = if (any(reported_any)) min(date[reported_any]) else as.Date(NA),
last_rep = if (any(reported_any)) max(date[reported_any]) else as.Date(NA),
last_date = max(date)
) |>
dplyr::ungroup()
# méthode 2 : actif à partir du premier rapport ; inactif seulement après
# expiration de la période de grâce suivant le dernier rapport
panel_df <- panel_df |>
dplyr::mutate(
months_since_last = dplyr::if_else(
is.na(last_rep),
Inf,
as.numeric(
lubridate::interval(last_rep, last_date) / lubridate::dmonths(1)
)
),
is_active = dplyr::case_when(
is.na(first_rep) ~ FALSE,
date < first_rep ~ FALSE,
date <= last_rep ~ TRUE,
months_since_last < nonreport_window ~ TRUE,
TRUE ~ FALSE
)
)
# agrégation par yearmon × unité administrative
df_expected <- panel_df |>
dplyr::group_by(yearmon, adm0, adm1, adm2, adm3) |>
dplyr::summarise(
denominator = sum(is_active, na.rm = TRUE),
.groups = "drop"
) |>
dplyr::arrange(yearmon, adm0, adm1, adm2, adm3)
compute_rep_rate <- function(panel_df, level, indicator) {
level_col <- paste0("adm", level)
group_vars <- c("yearmon", level_col)
# filtre actif : garder seulement les couples établissement-mois où
# l'établissement était censé notifier (is_active). c'est ce qui fait que
# `exp` est le décompte des établissements actifs, pas tous ceux dans l'export.
panel_df |>
dplyr::filter(is_active) |>
dplyr::mutate(
reported_any_var = !is.na(.data[[indicator]])
) |>
dplyr::group_by(dplyr::across(dplyr::all_of(group_vars))) |>
dplyr::summarise(
# compter les établissements distincts, pas les lignes, au cas où le
# panel contiendrait des doublons de couples établissement-mois.
rep = dplyr::n_distinct(hf_uid[reported_any_var]),
exp = dplyr::n_distinct(hf_uid),
.groups = "drop"
) |>
dplyr::mutate(
reprate = dplyr::if_else(exp > 0, rep / exp, NA_real_),
missrate = dplyr::if_else(!is.na(reprate), 1 - reprate, NA_real_),
indicator = indicator
) |>
dplyr::select(
dplyr::all_of(group_vars),
indicator,
rep, exp, reprate, missrate
)
}
indicator <- "conf"
level <- 3
df_rr <- compute_rep_rate(panel_df, level, indicator)
# enregistrer pour les workflows de stratification et correction de charge en aval
save_path <- here::here(
"01_data",
"1.2_epidemiology",
"1.2a_routine_surveillance",
"processed"
)
saveRDS(
df_rr,
here::here(
save_path,
paste0("monthly_", indicator, "_reprate_adm", level, ".rds")
)
)
df_rr <- sntutils::calculate_reporting_metrics(
data = dhis2_df,
vars_of_interest = "conf",
x_var = "yearmon",
y_var = paste0("adm", level),
hf_col = "hf_uid",
key_indicators = c("allout", "conf", "test", "treat", "pres"),
# méthode : 1 = permanent, 2 = premier-au-dernier, 3 = dynamique
method = 2,
# fenêtre de grâce / dynamique en mois
nonreport_window = 6
)
compute_rep_rate_weighted <- function(
panel_df,
level,
indicator,
weight_var = "test",
weight_window = 12,
exclude_current_x = TRUE,
cold_start = "median_within_y"
) {
level_col <- paste0("adm", level)
group_vars <- c("yearmon", level_col)
# 1. typical_size : moyenne mobile de weight_var sur les weight_window mois
# précédents pour chaque établissement. calculée sur le panel équilibré
# complet afin que la fenêtre respecte l'espacement calendaire — les mois
# où un établissement était inactif entrent comme NA et sortent via na.rm.
before_n <- if (exclude_current_x) weight_window else weight_window - 1
after_n <- if (exclude_current_x) -1L else 0L
weight_data <- panel_df |>
dplyr::arrange(hf_uid, date) |>
dplyr::group_by(hf_uid) |>
dplyr::mutate(
typical_size = slider::slide_dbl(
.data[[weight_var]],
base::mean,
na.rm = TRUE,
.before = before_n,
.after = after_n,
.complete = FALSE
),
is_cold_start = is.na(typical_size)
) |>
dplyr::ungroup()
# 2. valeur de secours cold-start.
# un couple établissement-mois est un « cold-start » si sa fenêtre mobile
# n'avait pas de données utilisables — typiquement un établissement
# nouvellement ouvert dont les premiers weight_window mois dans le panel
# sont NA, ou un établissement dans les premiers mois du jeu de données
# sans historique préalable. on ne peut pas supprimer ces lignes (ce sont
# encore des couples établissement-mois actifs qui ont besoin d'un poids),
# et on ne peut pas laisser typical_size comme NA (la ligne sortirait alors
# silencieusement de la normalisation au sein du groupe). on remplit donc
# typical_size en empruntant à un voisin :
#
# - cold_start = "median_within_y" (défaut) : la médiane de typical_size
# des établissements de la même unité admin qui ont un historique.
# suppose qu'un nouvel établissement ressemble à un établissement
# typique de son district.
# - cold_start = "median_global" : la médiane globale sur tous les
# couples établissement-mois « chauds ». utiliser quand les unités
# admin sont petites ou quand la médiane intra-admin est elle-même peu
# fiable.
#
# is_cold_start est capturé avant coalesce afin que le contrôle qa
# ci-dessous puisse toujours signaler combien de couples ont eu besoin du
# secours.
global_median <- stats::median(
weight_data$typical_size[!weight_data$is_cold_start],
na.rm = TRUE
)
if (cold_start == "median_within_y") {
within_y_median <- weight_data |>
dplyr::filter(!is_cold_start) |>
dplyr::group_by(dplyr::across(dplyr::all_of(level_col))) |>
dplyr::summarise(
cold_start_value = stats::median(typical_size, na.rm = TRUE),
.groups = "drop"
)
weight_data <- weight_data |>
dplyr::left_join(within_y_median, by = level_col) |>
dplyr::mutate(
typical_size = dplyr::coalesce(
typical_size, cold_start_value, global_median
)
)
} else {
weight_data <- weight_data |>
dplyr::mutate(
typical_size = dplyr::coalesce(typical_size, global_median)
)
}
# 3. normaliser les poids pour qu'ils somment à 1 au sein de yearmon × adm.
weight_data <- weight_data |>
dplyr::group_by(dplyr::across(dplyr::all_of(group_vars))) |>
dplyr::mutate(
weight = typical_size / sum(typical_size, na.rm = TRUE),
weight = dplyr::if_else(
is.na(weight) | is.infinite(weight), 0, weight
)
) |>
dplyr::ungroup()
# 4. qa : avertir si les poids d'un groupe ne somment pas à 1, et si plus
# de 25 % des couples établissement-mois *actifs* dans une période sont des
# cold-starts.
weight_check <- weight_data |>
dplyr::group_by(dplyr::across(dplyr::all_of(group_vars))) |>
dplyr::summarise(
weight_sum = sum(weight, na.rm = TRUE),
.groups = "drop"
) |>
dplyr::filter(abs(weight_sum - 1) > 1e-6)
if (nrow(weight_check) > 0) {
cli::cli_warn(c(
"!" = "Les poids ne somment pas à 1 dans {nrow(weight_check)} groupes",
"i" = "Vérifier la qualité des données et les calculs de poids"
))
}
cold_start_check <- weight_data |>
dplyr::filter(is_active) |>
dplyr::group_by(yearmon) |>
dplyr::summarise(
n_total = dplyr::n(),
n_cold_start = sum(is_cold_start),
prop_cold_start = n_cold_start / n_total,
.groups = "drop"
) |>
dplyr::filter(prop_cold_start > 0.25)
if (nrow(cold_start_check) > 0) {
cli::cli_warn(c(
"!" = ">25 % de cold starts dans {nrow(cold_start_check)} périodes",
"i" = "Envisager d'ajuster weight_window ou la plage de données"
))
}
# 5. filtre actif : supprimer les couples inactifs avant l'agrégation
# afin que le dénominateur pondéré corresponde au non pondéré.
data_with_weights <- weight_data |>
dplyr::filter(is_active) |>
dplyr::mutate(
reported_any_var = !is.na(.data[[indicator]])
)
# 6. agrégation par établissement au sein de yearmon × adm. chaque
# établissement a une ligne par période dans le panel équilibré, donc
# cette étape se réduit à l'identité, mais le pas explicite rend le
# résumé par groupe ci-dessous facile à lire.
facility_summary <- data_with_weights |>
dplyr::group_by(
dplyr::across(dplyr::all_of(c(group_vars, "hf_uid")))
) |>
dplyr::summarise(
reported_facility = any(reported_any_var),
weight_facility = base::mean(weight, na.rm = TRUE),
weight_value_facility = base::mean(.data[[weight_var]], na.rm = TRUE),
.groups = "drop"
)
# 7. agrégation par groupe : rep / exp / reprate / missrate non pondérés,
# reprate_w / missrate_w pondérés, et statistiques de synthèse de weight_var.
facility_summary |>
dplyr::group_by(dplyr::across(dplyr::all_of(group_vars))) |>
dplyr::summarise(
rep = sum(reported_facility),
exp = dplyr::n(),
w_num = sum(weight_facility * reported_facility, na.rm = TRUE),
w_den = sum(weight_facility, na.rm = TRUE),
reprate_w = dplyr::if_else(w_den > 0, w_num / w_den, NA_real_),
missrate_w = dplyr::if_else(!is.na(reprate_w), 1 - reprate_w, NA_real_),
!!paste0("avg_", weight_var) :=
base::mean(weight_value_facility, na.rm = TRUE),
!!paste0("min_", weight_var) :=
base::min(weight_value_facility, na.rm = TRUE),
!!paste0("max_", weight_var) :=
base::max(weight_value_facility, na.rm = TRUE),
.groups = "drop"
) |>
dplyr::mutate(
reprate = dplyr::if_else(exp > 0, rep / exp, NA_real_),
missrate = dplyr::if_else(!is.na(reprate), 1 - reprate, NA_real_),
indicator = indicator
) |>
dplyr::select(
dplyr::all_of(group_vars),
indicator,
rep, exp, reprate, missrate,
reprate_w, missrate_w,
dplyr::starts_with("avg_"),
dplyr::starts_with("min_"),
dplyr::starts_with("max_")
)
}
df_rr_w <- compute_rep_rate_weighted(
panel_df, level, indicator,
weight_var = "test"
)
df_rr_w <- sntutils::calculate_reporting_metrics(
data = dhis2_df,
vars_of_interest = "conf",
x_var = "yearmon",
y_var = paste0("adm", level),
hf_col = "hf_uid",
key_indicators = c("allout", "conf", "test", "treat", "pres"),
method = 2,
nonreport_window = 6,
weighting = TRUE,
weight_var = "test",
weight_window = 12,
exclude_current_x = TRUE,
cold_start = "median_within_y"
)
# taux de notification non pondéré et pondéré à adm2 pour l'indicateur en cours
df_rr_adm2 <- compute_rep_rate(panel_df, 2, indicator)
df_rr_w_adm2 <- compute_rep_rate_weighted(
panel_df, 2, indicator,
weight_var = "test"
)
# un point par (adm2 × année) : moyenner les 12 mois de chaque année afin
# que chaque panneau du nuage montre le même ensemble de districts.
df_compare_adm2 <- df_rr_adm2 |>
dplyr::select(yearmon, adm2, reprate, exp) |>
dplyr::left_join(
df_rr_w_adm2 |> dplyr::select(yearmon, adm2, reprate_w),
by = c("yearmon", "adm2")
) |>
dplyr::mutate(year = substr(yearmon, 1, 4)) |>
dplyr::group_by(adm2, year) |>
dplyr::summarise(
reprate = base::mean(reprate, na.rm = TRUE),
reprate_w = base::mean(reprate_w, na.rm = TRUE),
n_active = base::mean(exp, na.rm = TRUE),
.groups = "drop"
) |>
dplyr::mutate(
# différence relative en pourcentage (protection contre la division par zéro)
relat_diff_pct = 100 *
base::abs(reprate_w - reprate) /
base::pmax(reprate, .Machine$double.eps),
diff_tier = dplyr::case_when(
relat_diff_pct >= 20 ~ "Very High",
relat_diff_pct >= 5 ~ "High",
relat_diff_pct >= 1 ~ "Moderate",
TRUE ~ "Same"
),
diff_tier = base::factor(
diff_tier,
levels = c("Same", "Moderate", "High", "Very High")
)
)
# x = non pondéré, y = pondéré ; la droite en pointillés marque la concordance parfaite.
ggplot2::ggplot(
df_compare_adm2,
ggplot2::aes(x = reprate, y = reprate_w)
) +
ggplot2::geom_abline(
slope = 1, intercept = 0,
color = "black", linetype = "dashed", alpha = 0.7
) +
ggplot2::geom_point(
ggplot2::aes(color = diff_tier, size = n_active),
alpha = 0.7, na.rm = TRUE
) +
ggplot2::scale_color_manual(
name = "Différence relative",
values = c(
"Same" = "#2166ac",
"Moderate" = "#92c5de",
"High" = "#f4a582",
"Very High" = "#b2182b"
),
labels = c(
"Same" = "Identique (<1 %)",
"Moderate" = "Modérée (1-5 %)",
"High" = "Élevée (5-20 %)",
"Very High" = "Très élevée (>20 %)"
),
drop = FALSE
) +
ggplot2::scale_size_continuous(
name = "Établissements actifs",
range = c(0.5, 4.5),
labels = scales::comma_format()
) +
ggplot2::scale_x_continuous(labels = scales::percent_format(accuracy = 1)) +
ggplot2::scale_y_continuous(labels = scales::percent_format(accuracy = 1)) +
ggplot2::coord_cartesian(xlim = c(0.5, 1), ylim = c(0.5, 1)) +
ggplot2::facet_wrap(~ year) +
ggplot2::labs(
title = paste0(
"Taux pondéré vs non pondéré pour ", indicator,
" par adm2"
),
subtitle = paste(
"Chaque point est un adm2 pour une année (moyenne sur 12 mois).",
"Droite en pointillés : concordance parfaite (1:1)."
),
x = "Taux de notification non pondéré",
y = "Taux de notification pondéré",
caption = paste(
"Points au-dessus : établissements silencieux plus petits que la moyenne.",
"\nPoints en dessous : établissements silencieux plus grands que la moyenne."
)
) +
ggplot2::theme_minimal() +
ggplot2::theme(
strip.text = ggplot2::element_text(size = 10),
axis.text = ggplot2::element_text(size = 8),
axis.line = ggplot2::element_line(color = "black", linewidth = 0.5),
legend.position = "bottom",
legend.spacing.x = ggplot2::unit(0.5, "cm"),
axis.title.x = ggplot2::element_text(margin = ggplot2::margin(t = 10)),
axis.title.y = ggplot2::element_text(margin = ggplot2::margin(r = 10))
)
indicators <- c("allout", "test", "conf", "pres", "maltreat")
plot_data <- purrr::map_dfr(indicators, function(i) {
compute_rep_rate(panel_df, level = 0, indicator = i) |>
dplyr::transmute(
yearmon,
indicator,
rr_pct = reprate * 100
)
})
# un mois sur trois sur l'axe x pour garder les étiquettes lisibles
yearmon_levels <- unique(plot_data$yearmon)
x_breaks <- yearmon_levels[seq(1, length(yearmon_levels), by = 3)]
ggplot2::ggplot(
plot_data,
ggplot2::aes(
x = yearmon,
y = forcats::fct_relevel(indicator, rev(indicators)),
fill = rr_pct
)
) +
ggplot2::geom_tile(colour = "white", linewidth = .2) +
ggplot2::scale_fill_gradientn(
colours = rev(wesanderson::wes_palette(
"Zissou1", 100, type = "continuous"
)),
limits = c(0, 100),
na.value = "grey90"
) +
ggplot2::guides(
fill = ggplot2::guide_colorbar(
title.position = "top",
nrow = 1,
label.position = "bottom",
direction = "horizontal",
barheight = ggplot2::unit(0.3, "cm"),
barwidth = ggplot2::unit(4, "cm"),
ticks = TRUE,
draw.ulim = TRUE,
draw.llim = TRUE
)
) +
ggplot2::scale_x_discrete(breaks = x_breaks, expand = c(0, 0)) +
ggplot2::scale_y_discrete(expand = c(0, 0)) +
ggplot2::labs(
fill = "Taux de notification (%)",
x = NULL,
y = "Indicateur",
title = "Taux de notification mensuel par indicateur (national)"
) +
ggplot2::theme_bw() +
ggplot2::theme(
legend.title = ggplot2::element_text(
size = 12,
face = "bold",
family = "sans"
),
legend.position = "bottom",
legend.direction = "horizontal",
legend.box = "horizontal",
legend.box.just = "center",
legend.margin = ggplot2::margin(t = 0, unit = "cm"),
legend.text = ggplot2::element_text(
size = 8,
family = "sans"
),
axis.title.x = ggplot2::element_text(
margin = ggplot2::margin(t = 5, unit = "pt")
),
axis.title.y = ggplot2::element_text(
margin = ggplot2::margin(r = 10, unit = "pt")
),
axis.text.x = ggplot2::element_text(
angle = 75,
hjust = 1,
family = "sans"
),
axis.text = ggplot2::element_text(family = "sans"),
axis.title = ggplot2::element_text(family = "sans"),
plot.title = ggtext::element_markdown(
size = 12,
family = "sans",
margin = ggplot2::margin(b = 10)
),
panel.grid.minor = ggplot2::element_blank(),
panel.grid.major = ggplot2::element_blank(),
panel.background = ggplot2::element_blank()
)
yearmon_levels <- unique(plot_data$yearmon)
x_breaks <- yearmon_levels[seq(1, length(yearmon_levels), by = 4)]
ggplot2::ggplot(
plot_data,
ggplot2::aes(
x = yearmon,
y = rr_pct / 100,
color = indicator,
group = indicator
)
) +
ggplot2::geom_line(linewidth = 0.75) +
ggplot2::scale_color_manual(
values = wesanderson::wes_palette("Zissou1", length(indicators),
type = "continuous")
) +
ggplot2::scale_x_discrete(breaks = x_breaks, expand = c(0.01, 0.01)) +
ggplot2::scale_y_continuous(labels = scales::percent_format(accuracy = 1)) +
ggplot2::coord_cartesian(ylim = c(0, 1)) +
ggplot2::labs(
x = NULL,
y = "Taux de notification",
title = "Taux de notification mensuel (national)",
color = "Indicateur"
) +
ggplot2::theme_bw() +
ggplot2::theme(
legend.position = "bottom",
legend.text = ggplot2::element_text(size = 8, family = "sans"),
axis.text.x = ggplot2::element_text(
angle = 75, hjust = 1, family = "sans"
),
axis.text = ggplot2::element_text(family = "sans"),
axis.title = ggplot2::element_text(family = "sans"),
plot.title = ggtext::element_markdown(
size = 12, family = "sans",
margin = ggplot2::margin(b = 10)
),
panel.grid.minor = ggplot2::element_blank()
)
indicator <- "conf"
level <- 2
group_lvl <- 1 # regrouper les lignes par ce niveau admin supérieur
# calculer et convertir en %
df_admin <- compute_rep_rate(panel_df, level, indicator) |>
dplyr::mutate(rr_pct = reprate * 100)
# attacher la colonne admin de regroupement
tree <- dhis2_df |>
dplyr::select(
dplyr::all_of(c(paste0("adm", level), paste0("adm", group_lvl)))
) |>
dplyr::distinct()
df_admin <- df_admin |>
dplyr::left_join(tree, by = paste0("adm", level)) |>
dplyr::arrange(
.data[[paste0("adm", group_lvl)]],
.data[[paste0("adm", level)]]
)
# classer les unités admin par groupe puis alphabétiquement
adm_order <- df_admin |>
dplyr::distinct(
dplyr::across(dplyr::all_of(
c(paste0("adm", group_lvl), paste0("adm", level))
))
) |>
dplyr::pull(paste0("adm", level))
yearmon_levels <- sort(unique(df_admin$yearmon))
x_breaks <- yearmon_levels[seq(1, length(yearmon_levels), by = 6)]
ggplot2::ggplot(
df_admin,
ggplot2::aes(
x = yearmon,
y = forcats::fct_relevel(.data[[paste0("adm", level)]], rev(adm_order)),
fill = rr_pct
)
) +
ggplot2::geom_tile(colour = "white", linewidth = .2) +
ggplot2::scale_fill_gradientn(
colours = rev(wesanderson::wes_palette(
"Zissou1", 100, type = "continuous"
)),
limits = c(0, 100),
na.value = "grey85"
) +
ggplot2::guides(
fill = ggplot2::guide_colorbar(
title.position = "top",
nrow = 1,
label.position = "bottom",
direction = "horizontal",
barheight = ggplot2::unit(0.3, "cm"),
barwidth = ggplot2::unit(4, "cm"),
ticks = TRUE,
draw.ulim = TRUE,
draw.llim = TRUE
)
) +
ggplot2::scale_x_discrete(breaks = x_breaks, expand = c(0, 0)) +
ggplot2::scale_y_discrete(expand = c(0, 0)) +
ggplot2::labs(
fill = "Taux de notification (%)",
x = NULL,
y = "District",
title = paste("Taux de notification mensuel", indicator, "par adm", level)
) +
ggplot2::theme_bw() +
ggplot2::theme(
legend.title = ggplot2::element_text(
size = 12,
face = "bold",
family = "sans"
),
legend.position = "bottom",
legend.direction = "horizontal",
legend.box = "horizontal",
legend.box.just = "center",
legend.margin = ggplot2::margin(t = 0, unit = "cm"),
legend.text = ggplot2::element_text(
size = 8,
family = "sans"
),
axis.title.x = ggplot2::element_text(
margin = ggplot2::margin(t = 5, unit = "pt")
),
axis.title.y = ggplot2::element_text(
margin = ggplot2::margin(r = 10, unit = "pt")
),
axis.text.x = ggplot2::element_text(
angle = 75,
hjust = 1,
family = "sans"
),
axis.text = ggplot2::element_text(family = "sans"),
axis.title = ggplot2::element_text(family = "sans"),
plot.title = ggtext::element_markdown(
size = 12,
family = "sans",
margin = ggplot2::margin(b = 10)
),
panel.grid.minor = ggplot2::element_blank(),
panel.grid.major = ggplot2::element_blank(),
panel.background = ggplot2::element_blank()
)
indicator <- "test"
level <- 3
target_adm2 <- "WESTERN RURAL"
df_line <- compute_rep_rate(panel_df, level, indicator)
tree <- dhis2_df |>
dplyr::select(adm2, dplyr::all_of(paste0("adm", level))) |>
dplyr::distinct()
df_line <- df_line |>
dplyr::left_join(tree, by = paste0("adm", level)) |>
dplyr::filter(adm2 == target_adm2)
yearmon_levels <- sort(unique(df_line$yearmon))
x_breaks <- yearmon_levels[seq(1, length(yearmon_levels), by = 4)]
n_adm <- dplyr::n_distinct(df_line[[paste0("adm", level)]])
ggplot2::ggplot(
df_line,
ggplot2::aes(
x = yearmon,
y = reprate,
color = .data[[paste0("adm", level)]],
group = .data[[paste0("adm", level)]]
)
) +
ggplot2::geom_line(linewidth = 0.75) +
ggplot2::scale_color_manual(
values = wesanderson::wes_palette("Zissou1", n_adm,
type = "continuous")
) +
ggplot2::scale_x_discrete(breaks = x_breaks, expand = c(0.01, 0.01)) +
ggplot2::scale_y_continuous(labels = scales::percent_format(accuracy = 1)) +
ggplot2::coord_cartesian(ylim = c(0, 1)) +
ggplot2::labs(
x = NULL,
y = "Taux de notification",
title = paste0("Taux de notification mensuel ", indicator, ", ", target_adm2),
color = NULL
) +
ggplot2::theme_bw() +
ggplot2::theme(
legend.position = "bottom",
legend.text = ggplot2::element_text(size = 8, family = "sans"),
axis.text.x = ggplot2::element_text(
angle = 75, hjust = 1, family = "sans"
),
axis.text = ggplot2::element_text(family = "sans"),
axis.title = ggplot2::element_text(family = "sans"),
plot.title = ggtext::element_markdown(
size = 12, family = "sans",
margin = ggplot2::margin(b = 10)
),
panel.grid.minor = ggplot2::element_blank()
)
indicator <- "conf"
# charger l'objet spatial adm2 traité
adm2_sf <- readRDS(here::here(
"01_data",
"1.1_foundational",
"1.1a_admin_boundaries",
"processed",
"sle_spatial_adm2_2021.rds"
)) |>
sf::st_as_sf()
# taux de notification annuel moyen par adm2 pour l'indicateur choisi
df_map <- compute_rep_rate(panel_df, 2, indicator) |>
dplyr::mutate(year = substr(yearmon, 1, 4)) |>
dplyr::group_by(adm2, year) |>
dplyr::summarise(
rr_pct = base::mean(reprate, na.rm = TRUE) * 100,
.groups = "drop"
)
# borne inférieure de l'échelle de couleurs : plancher du plus petit
# taux annuel observé. remplacer par une valeur fixe (ex. 0 ou 50)
# pour ancrer la légende sur une plage constante entre les rendus.
fill_min <- floor(min(df_map$rr_pct, na.rm = TRUE))
# attacher le taux de notification aux polygones
df_map_sf <- adm2_sf |>
dplyr::left_join(df_map, by = "adm2")
ggplot2::ggplot(df_map_sf) +
ggplot2::geom_sf(
ggplot2::aes(fill = rr_pct),
colour = "white", linewidth = .2
) +
ggplot2::scale_fill_gradientn(
colours = rev(wesanderson::wes_palette(
"Zissou1", 100, type = "continuous"
)),
limits = c(fill_min, 100),
na.value = "grey90",
name = "Taux de notification (%)"
) +
ggplot2::guides(
fill = ggplot2::guide_colorbar(
title.position = "top",
nrow = 1,
label.position = "bottom",
direction = "horizontal",
barheight = ggplot2::unit(0.3, "cm"),
barwidth = ggplot2::unit(4, "cm"),
ticks = TRUE,
draw.ulim = TRUE,
draw.llim = TRUE
)
) +
ggplot2::facet_wrap(~ year, nrow = 3) +
ggplot2::labs(
title = paste0(
"Taux de notification annuel ", indicator, " par adm2"
)
) +
ggplot2::theme_bw() +
ggplot2::theme(
legend.title = ggplot2::element_text(
size = 12, face = "bold", family = "sans"
),
legend.position = "bottom",
legend.direction = "horizontal",
legend.box = "horizontal",
legend.box.just = "center",
legend.margin = ggplot2::margin(t = 0, unit = "cm"),
legend.text = ggplot2::element_text(size = 8, family = "sans"),
axis.text = ggplot2::element_blank(),
axis.title = ggplot2::element_blank(),
axis.ticks = ggplot2::element_blank(),
panel.grid.minor = ggplot2::element_blank(),
panel.grid.major = ggplot2::element_blank(),
panel.background = ggplot2::element_blank(),
strip.text = ggplot2::element_text(family = "sans", face = "bold"),
strip.background = ggplot2::element_blank(),
plot.title = ggtext::element_markdown(
size = 12, family = "sans",
margin = ggplot2::margin(b = 10)
)
)
sntutils::reporting_rate_map(
data = dhis2_df,
shapefile = adm2_sf,
x_var = "yearmon",
adm_var = "adm2",
vars_of_interest = "conf",
hf_col = "hf_uid",
key_indicators = c("allout", "conf", "test", "treat", "pres"),
method = 2,
nonreport_window = 6
)Show full code
################################################################################
######## ~ Taux de notification des établissements de santé full code ~ ########
################################################################################
### Step -----------------------------------------------------------------------
from pathlib import Path
import geopandas as gpd
import matplotlib.colors as mcolors
import matplotlib.pyplot as plt
import matplotlib.ticker as mticker
import numpy as np
import pandas as pd
import pyreadr
from pyprojroot import here
# ── fonctions d'aide cli ──────────────────────────────────────────────────────
def cli_header(message):
print(f"\n{message}")
def cli_info(message):
print(f"INFO: {message}")
def cli_success(message):
print(f"SUCCESS: {message}")
def cli_warning(message):
print(f"WARNING: {message}")
def cli_danger(message):
print(f"ERROR: {message}")
def anti_join(left, right, on):
"""Retourne les lignes de left sans correspondance dans right."""
right_keys = right[on].drop_duplicates()
return (
left.merge(right_keys, on=on, how="left", indicator=True)
.loc[lambda x: x["_merge"] == "left_only"]
.drop(columns="_merge")
)
# ── aide pour les tableaux html (miroir de R show_table) ─────────────────────
def show_table(df, n=10, caption=None, digits=2):
"""Affiche les n premières lignes en HTML défilant avec le style .out-table."""
subset = df.head(n).copy()
for col in subset.select_dtypes(include="number").columns:
subset[col] = subset[col].round(digits)
html = subset.to_html(
index=False,
border=0,
classes="out-table",
na_rep="",
)
if caption:
html = f"<caption>{caption}</caption>" + html
print(f'<div class="out-scroll">{html}</div>')
from pathlib import Path

import pandas as pd
from pyprojroot import here

dhis2_df = pd.read_parquet(Path(here(
    "01_data/1.2_epidemiology"
    "/1.2a_routine_surveillance/processed"
    "/clean_malaria_routine_data_final.parquet"
)))

dhis2_df = dhis2_df.assign(
    date=lambda d: pd.to_datetime(d["date"], errors="coerce"),
    yearmon=lambda d: d["date"].dt.strftime("%Y-%m"),
)
import numpy as np
import pandas as pd

# paramètres de la méthode 2
key_indicators   = ["allout", "test", "pres", "conf", "maltreat", "maladm"]
nonreport_window = 6

# panel équilibré établissements × mois
month_seq = pd.date_range(dhis2_df["date"].min(), dhis2_df["date"].max(), freq="MS")
panel = pd.MultiIndex.from_product(
    [dhis2_df["hf_uid"].unique(), month_seq],
    names=["hf_uid", "date"]
).to_frame(index=False)

panel_df = (
    panel.merge(dhis2_df, on=["hf_uid", "date"], how="left")
    .sort_values(["hf_uid", "date"])
)

# propagation avant puis arrière des métadonnées admin par groupe d'établissement
meta_cols = ["adm0", "adm1", "adm2", "adm3"]
panel_df[meta_cols] = (
    panel_df.groupby("hf_uid")[meta_cols]
    .transform(lambda s: s.ffill().bfill())
)

# ajouter les colonnes d'indicateurs clés manquantes pour que le prédicat soit cohérent
for _col in key_indicators:
    if _col not in panel_df.columns:
        panel_df[_col] = np.nan

panel_df = panel_df.assign(
    yearmon=lambda d: d["date"].dt.strftime("%Y-%m"),
    reported_any=lambda d: d[key_indicators].notna().any(axis=1),
)

# dates de première / dernière notification et dernière date du panel par établissement
def _facility_dates(g):
    g = g.copy()
    mask = g["reported_any"]
    if mask.any():
        g["first_rep"] = g.loc[mask, "date"].min()
        g["last_rep"]  = g.loc[mask, "date"].max()
    else:
        g["first_rep"] = pd.NaT
        g["last_rep"]  = pd.NaT
    g["last_date"] = g["date"].max()
    return g

panel_df = (
    panel_df.sort_values(["hf_uid", "date"])
    .groupby("hf_uid", group_keys=False)
    .apply(_facility_dates)
    .reset_index(drop=True)
)

# mois_depuis_dernier par établissement (correspond à lubridate::dmonths(1) = 30,4375 jours)
def _months_since(g):
    g = g.copy()
    if g["last_rep"].isna().all():
        g["months_since_last"] = np.inf
    else:
        last_rep  = g["last_rep"].iloc[0]
        last_date = g["last_date"].iloc[0]
        g["months_since_last"] = (last_date - last_rep).days / 30.4375
    return g

panel_df = (
    panel_df.groupby("hf_uid", group_keys=False)
    .apply(_months_since)
    .reset_index(drop=True)
)

# méthode 2 : actif dès le premier rapport ; inactif seulement après expiration de la période de grâce
panel_df["is_active"] = np.select(
    [
        panel_df["first_rep"].isna(),
        panel_df["date"] < panel_df["first_rep"],
        panel_df["date"] <= panel_df["last_rep"],
        (panel_df["date"] > panel_df["last_rep"])
        & (panel_df["months_since_last"] < nonreport_window),
    ],
    [0, 0, 1, 1],
    default=0,
).astype(bool)

# dénombrements d'établissements attendus par yearmon × unité admin
df_expected = (
    panel_df
    .groupby(["yearmon", "adm0", "adm1", "adm2", "adm3"], as_index=False)
    .agg(denominator=("is_active", "sum"))
    .sort_values(["yearmon", "adm0", "adm1", "adm2", "adm3"])
    .reset_index(drop=True)
)
def compute_rep_rate(panel_df, level, indicator):
    """
    Calcule le taux de notification mensuel non pondéré pour un indicateur à
    un niveau admin. Miroir colonne par colonne de R compute_rep_rate().

    Retourne un DataFrame avec les colonnes :
        yearmon, adm<level>, indicator, rep, exp, reprate, missrate
    """
    level_col  = f"adm{level}"
    group_vars = ["yearmon", level_col]

    active = panel_df.loc[panel_df["is_active"]].copy()
    active["reported_any_var"] = active[indicator].notna()

    # n_distinct(hf_uid ayant notifié) et n_distinct(hf_uid total)
    def _agg(g):
        rep = g.loc[g["reported_any_var"], "hf_uid"].nunique()
        exp = g["hf_uid"].nunique()
        return pd.Series({"rep": rep, "exp": exp})

    result = (
        active
        .groupby(group_vars, as_index=False)
        .apply(_agg, include_groups=False)
        .reset_index(drop=True)
    )

    result = result.assign(
        reprate=lambda d: np.where(
            d["exp"] > 0, d["rep"] / d["exp"], np.nan
        ),
        missrate=lambda d: np.where(
            d["reprate"].notna(), 1 - d["reprate"], np.nan
        ),
        indicator=indicator,
    )

    col_order = group_vars + ["indicator", "rep", "exp", "reprate", "missrate"]
    return result[col_order]
from pathlib import Path

import pandas as pd
from pyprojroot import here

indicator = "conf"
level     = 3

df_rr = compute_rep_rate(panel_df, level, indicator)

# enregistrer pour les workflows de stratification et correction de charge en aval
save_path = Path(here(
    "01_data/1.2_epidemiology"
    "/1.2a_routine_surveillance/processed"
))

df_rr.to_parquet(
    save_path / f"monthly_{indicator}_reprate_adm{level}.parquet",
    index=False,
)
import numpy as np
import pandas as pd

def compute_rep_rate_weighted(
    panel_df,
    level,
    indicator,
    weight_var="test",
    weight_window=12,
    exclude_current_x=True,
    cold_start="median_within_y",
):
    """
    Calcule le taux de notification mensuel pondéré. Miroir colonne par
    colonne de R compute_rep_rate_weighted().
    """
    level_col  = f"adm{level}"
    group_vars = ["yearmon", level_col]

    # 1. typical_size : moyenne mobile sur les weight_window mois précédents,
    #    excluant la période en cours quand exclude_current_x est True.
    #    le rolling pandas est sur les lignes ; trier par hf_uid + date d'abord.
    weight_data = panel_df.sort_values(["hf_uid", "date"]).copy()

    # décaler les bornes de la fenêtre pour correspondre à slider::slide_dbl
    # before = weight_window, after = -1  ➜  exclure la ligne en cours
    # before = weight_window - 1, after = 0 ➜  inclure la ligne en cours
    window = weight_window  # toujours regarder en arrière ce nombre de lignes

    def _rolling_mean(g):
        g = g.copy()
        vals = g[weight_var].copy()
        if exclude_current_x:
            # exclure le courant : décaler de 1 pour que la fenêtre couvre t-12..t-1
            shifted = vals.shift(1)
            g["typical_size"] = (
                shifted.rolling(window=window, min_periods=1).mean()
            )
        else:
            # inclure le courant : la fenêtre couvre t-(window-1)..t
            g["typical_size"] = (
                vals.rolling(window=window, min_periods=1).mean()
            )
        g["is_cold_start"] = g["typical_size"].isna()
        return g

    weight_data = (
        weight_data
        .groupby("hf_uid", group_keys=False)
        .apply(_rolling_mean)
        .reset_index(drop=True)
    )

    # 2. valeur de secours cold-start
    global_median = weight_data.loc[
        ~weight_data["is_cold_start"], "typical_size"
    ].median()

    if cold_start == "median_within_y" and level > 0:
        within_y_median = (
            weight_data.loc[~weight_data["is_cold_start"]]
            .groupby(level_col, as_index=False)
            .agg(cold_start_value=("typical_size", "median"))
        )
        weight_data = weight_data.merge(within_y_median, on=level_col, how="left")
        weight_data["typical_size"] = (
            weight_data["typical_size"]
            .fillna(weight_data["cold_start_value"])
            .fillna(global_median)
        )
    else:
        weight_data["typical_size"] = (
            weight_data["typical_size"].fillna(global_median)
        )

    # 3. normaliser les poids pour qu'ils somment à 1 au sein de yearmon × adm
    grp_cols_w = group_vars
    weight_data["_group_sum"] = (
        weight_data.groupby(grp_cols_w)["typical_size"]
        .transform("sum")
    )
    weight_data["weight"] = np.where(
        weight_data["_group_sum"] > 0,
        weight_data["typical_size"] / weight_data["_group_sum"],
        0.0,
    )
    weight_data["weight"] = weight_data["weight"].replace(
        [np.inf, -np.inf], 0.0
    ).fillna(0.0)

    # 4. avertissements qa
    weight_check = (
        weight_data
        .groupby(grp_cols_w, as_index=False)
        .agg(weight_sum=("weight", "sum"))
        .loc[lambda d: (d["weight_sum"] - 1).abs() > 1e-6]
    )
    if len(weight_check) > 0:
        cli_warning(
            f"Les poids ne somment pas à 1 dans {len(weight_check)} groupes — "
            "vérifier la qualité des données et les calculs de poids"
        )

    cold_check = (
        weight_data.loc[weight_data["is_active"]]
        .groupby("yearmon", as_index=False)
        .apply(
            lambda g: pd.Series({
                "n_total": len(g),
                "n_cold_start": g["is_cold_start"].sum(),
            }),
            include_groups=False,
        )
        .reset_index(drop=True)
    )
    cold_check["prop_cold_start"] = (
        cold_check["n_cold_start"] / cold_check["n_total"]
    )
    cold_check = cold_check.loc[cold_check["prop_cold_start"] > 0.25]
    if len(cold_check) > 0:
        cli_warning(
            f">25 % de cold starts dans {len(cold_check)} périodes — "
            "envisager d'ajuster weight_window ou la plage de données"
        )

    # 5. filtre actif
    active_w = weight_data.loc[weight_data["is_active"]].copy()
    active_w["reported_any_var"] = active_w[indicator].notna()

    # 6. agrégation par établissement au sein de yearmon × adm
    fac_grp = grp_cols_w + ["hf_uid"]
    facility_summary = (
        active_w
        .groupby(fac_grp, as_index=False)
        .agg(
            reported_facility=("reported_any_var", "any"),
            weight_facility=(f"weight", "mean"),
            weight_value_facility=(weight_var, "mean"),
        )
    )

    # 7. agrégation par groupe
    def _group_agg(g):
        rep    = int(g["reported_facility"].sum())
        exp    = len(g)
        w_num  = (g["weight_facility"] * g["reported_facility"]).sum()
        w_den  = g["weight_facility"].sum()
        rr_w   = w_num / w_den if w_den > 0 else np.nan
        return pd.Series({
            "rep": rep,
            "exp": exp,
            "w_num": w_num,
            "w_den": w_den,
            "reprate_w": rr_w,
            "missrate_w": (1 - rr_w) if not np.isnan(rr_w) else np.nan,
            f"avg_{weight_var}": g["weight_value_facility"].mean(),
            f"min_{weight_var}": g["weight_value_facility"].min(),
            f"max_{weight_var}": g["weight_value_facility"].max(),
        })

    result = (
        facility_summary
        .groupby(grp_cols_w, as_index=False)
        .apply(_group_agg, include_groups=False)
        .reset_index(drop=True)
    )

    result = result.assign(
        reprate=lambda d: np.where(d["exp"] > 0, d["rep"] / d["exp"], np.nan),
        missrate=lambda d: np.where(
            d["reprate"].notna(), 1 - d["reprate"], np.nan
        ),
        indicator=indicator,
    )

    col_order = (
        grp_cols_w
        + ["indicator", "rep", "exp", "reprate", "missrate",
           "reprate_w", "missrate_w",
           f"avg_{weight_var}", f"min_{weight_var}", f"max_{weight_var}"]
    )
    return result[col_order]


df_rr_w = compute_rep_rate_weighted(
    panel_df, level, indicator,
    weight_var="test",
)
import matplotlib.pyplot as plt
import numpy as np
import pandas as pd

# taux de notification non pondéré et pondéré à adm2 pour l'indicateur en cours
df_rr_adm2   = compute_rep_rate(panel_df, 2, indicator)
df_rr_w_adm2 = compute_rep_rate_weighted(
    panel_df, 2, indicator, weight_var="test"
)

# un point par (adm2 × année) : moyenner les 12 mois de chaque année
df_compare_adm2 = (
    df_rr_adm2[["yearmon", "adm2", "reprate", "exp"]]
    .merge(
        df_rr_w_adm2[["yearmon", "adm2", "reprate_w"]],
        on=["yearmon", "adm2"],
    )
    .assign(year=lambda d: d["yearmon"].str[:4])
    .groupby(["adm2", "year"], as_index=False)
    .agg(
        reprate=("reprate", "mean"),
        reprate_w=("reprate_w", "mean"),
        n_active=("exp", "mean"),
    )
)

# classer la différence relative
eps = np.finfo(float).eps
df_compare_adm2 = df_compare_adm2.assign(
    relat_diff_pct=lambda d: (
        100 * (d["reprate_w"] - d["reprate"]).abs()
        / d["reprate"].clip(lower=eps)
    ),
    diff_tier=lambda d: pd.Categorical(
        np.select(
            [
                d["relat_diff_pct"] >= 20,
                d["relat_diff_pct"] >= 5,
                d["relat_diff_pct"] >= 1,
            ],
            ["Very High", "High", "Moderate"],
            default="Same",
        ),
        categories=["Same", "Moderate", "High", "Very High"],
        ordered=True,
    ),
)

tier_colors = {
    "Same":      "#2166ac",
    "Moderate":  "#92c5de",
    "High":      "#f4a582",
    "Very High": "#b2182b",
}
tier_labels = {
    "Same":      "Identique (<1 %)",
    "Moderate":  "Modérée (1-5 %)",
    "High":      "Élevée (5-20 %)",
    "Very High": "Très élevée (>20 %)",
}

years = sorted(df_compare_adm2["year"].unique())
n_cols = min(len(years), 4)
n_rows = (len(years) + n_cols - 1) // n_cols

fig, axes = plt.subplots(n_rows, n_cols, figsize=(12, 8), squeeze=False)
axes_flat = axes.flatten()

for ax_idx, yr in enumerate(years):
    ax = axes_flat[ax_idx]
    sub = df_compare_adm2.loc[df_compare_adm2["year"] == yr]

    # droite de référence 1:1 en pointillés
    ax.axline((0.5, 0.5), slope=1, color="black", linestyle="--", alpha=0.7)

    for tier in ["Same", "Moderate", "High", "Very High"]:
        pts = sub.loc[sub["diff_tier"] == tier]
        if pts.empty:
            continue
        # mettre à l'échelle la taille des bulles pour correspondre à ggplot scale_size range(0.5, 4.5)
        sz_norm = (pts["n_active"] - pts["n_active"].min()) / (
            pts["n_active"].max() - pts["n_active"].min() + 1e-9
        )
        sizes = 10 + sz_norm * 150
        ax.scatter(
            pts["reprate"],
            pts["reprate_w"],
            c=tier_colors[tier],
            s=sizes,
            alpha=0.7,
            label=tier_labels[tier],
            zorder=3,
        )

    ax.set_xlim(0.5, 1)
    ax.set_ylim(0.5, 1)
    ax.xaxis.set_major_formatter(mticker.PercentFormatter(xmax=1, decimals=0))
    ax.yaxis.set_major_formatter(mticker.PercentFormatter(xmax=1, decimals=0))
    ax.set_title(yr, fontsize=10)
    ax.tick_params(labelsize=8)
    ax.spines[["top", "right"]].set_visible(False)
    ax.spines[["left", "bottom"]].set_linewidth(0.5)
    ax.set_xlabel("Taux de notification non pondéré", fontsize=8)
    ax.set_ylabel("Taux de notification pondéré", fontsize=8)

# masquer les axes inutilisés
for ax in axes_flat[len(years):]:
    ax.set_visible(False)

# légende partagée en bas
handles, labels_leg = axes_flat[0].get_legend_handles_labels()
seen = {}
unique_h, unique_l = [], []
for h, lbl in zip(handles, labels_leg):
    if lbl not in seen:
        seen[lbl] = True
        unique_h.append(h)
        unique_l.append(lbl)

fig.legend(
    unique_h, unique_l,
    title="Différence relative",
    loc="lower center",
    ncol=4,
    fontsize=8,
    bbox_to_anchor=(0.5, -0.02),
)
fig.suptitle(
    f"Taux pondéré vs non pondéré pour {indicator} par adm2\n"
    "Chaque point est un adm2 pour une année (moyenne sur 12 mois). "
    "Droite en pointillés : concordance parfaite (1:1).",
    fontsize=11,
    y=1.01,
)
plt.tight_layout()
import matplotlib.colors as mcolors
import matplotlib.pyplot as plt
import numpy as np
import pandas as pd

indicators = ["allout", "test", "conf", "pres", "maltreat"]

_frames = []
for i in indicators:
    _df = compute_rep_rate(panel_df, level=0, indicator=i)
    _df["rr_pct"] = _df["reprate"] * 100
    _frames.append(_df[["yearmon", "indicator", "rr_pct"]])
plot_data = pd.concat(_frames, ignore_index=True)

yearmon_levels = sorted(plot_data["yearmon"].unique())
# un mois sur trois sur l'axe x pour garder les étiquettes lisibles
x_breaks = yearmon_levels[::3]

# palette Zissou1 inversée pour le taux de notification (élevé = bleu = bien)
zissou1_colors = ["#3B9AB2", "#78B7C5", "#EBCC2A", "#E1AF00", "#F21A00"]
zissou1_cmap   = mcolors.LinearSegmentedColormap.from_list(
    "Zissou1", zissou1_colors, N=100
)
zissou1_r_cmap = zissou1_cmap.reversed()

# pivoter en matrice : lignes = indicateurs (bas vers haut), cols = yearmon
# R utilise fct_relevel(indicator, rev(indicators)) → premier indicateur en haut
ind_order  = list(reversed(indicators))
pivot = (
    plot_data
    .pivot(index="indicator", columns="yearmon", values="rr_pct")
    .reindex(index=ind_order, columns=yearmon_levels)
)

fig, ax = plt.subplots(figsize=(10, 5))
mesh = ax.pcolormesh(
    np.arange(len(yearmon_levels) + 1),
    np.arange(len(ind_order) + 1),
    pivot.values,
    cmap=zissou1_r_cmap,
    vmin=0,
    vmax=100,
    linewidth=0.5,
    edgecolors="white",
    antialiased=False,
)
ax.set_aspect("auto")

# x-axis: show only x_breaks labels
xtick_pos = [yearmon_levels.index(ym) + 0.5 for ym in x_breaks]
ax.set_xticks(xtick_pos)
ax.set_xticklabels(x_breaks, rotation=75, ha="right", fontsize=8)

ax.set_yticks(np.arange(len(ind_order)) + 0.5)
ax.set_yticklabels(ind_order, fontsize=8)

ax.set_xlabel("")
ax.set_ylabel("Indicateur", fontsize=9)
ax.set_title(
    "Taux de notification mensuel par indicateur (national)", fontsize=12, pad=10
)
ax.grid(False)

# barre de couleur horizontale en bas
cbar = fig.colorbar(
    mesh, ax=ax, orientation="horizontal",
    fraction=0.03, pad=0.22, aspect=40,
)
cbar.set_label("Taux de notification (%)", fontsize=12, fontweight="bold")
cbar.ax.tick_params(labelsize=8)

plt.tight_layout()
import matplotlib.colors as mcolors
import matplotlib.pyplot as plt
import numpy as np

yearmon_levels_line = sorted(plot_data["yearmon"].unique())
# un mois sur quatre sur l'axe x
x_breaks_line = yearmon_levels_line[::4]

# palette Zissou1 échantillonnée à len(indicators) positions (non inversée pour les lignes)
zissou1_line = mcolors.LinearSegmentedColormap.from_list(
    "Zissou1", ["#3B9AB2", "#78B7C5", "#EBCC2A", "#E1AF00", "#F21A00"], N=100
)
n_ind = len(indicators)
line_colors = [zissou1_line(i / max(n_ind - 1, 1)) for i in range(n_ind)]

fig, ax = plt.subplots(figsize=(12, 6))

for idx, ind in enumerate(indicators):
    sub = (
        plot_data.loc[plot_data["indicator"] == ind]
        .sort_values("yearmon")
    )
    # convertir le pourcentage en proportion pour l'axe y
    ax.plot(
        sub["yearmon"],
        sub["rr_pct"] / 100,
        linewidth=0.75,
        color=line_colors[idx],
        label=ind,
    )

ax.set_xticks(
    [yearmon_levels_line.index(ym) for ym in x_breaks_line]
)
ax.set_xticklabels(x_breaks_line, rotation=75, ha="right", fontsize=8)
ax.yaxis.set_major_formatter(mticker.PercentFormatter(xmax=1, decimals=0))
ax.set_ylim(0, 1)
ax.set_xlabel("")
ax.set_ylabel("Taux de notification", fontsize=9)
ax.set_title("Taux de notification mensuel (national)", fontsize=12, pad=10)
ax.tick_params(labelsize=8)
ax.legend(title="Indicateur", fontsize=8, loc="lower center",
          ncol=len(indicators), bbox_to_anchor=(0.5, -0.35))
ax.grid(axis="y", linewidth=0.4, alpha=0.5)
ax.grid(axis="x", visible=False)
for spine in ["top", "right"]:
    ax.spines[spine].set_visible(False)
plt.tight_layout()
import matplotlib.colors as mcolors
import matplotlib.pyplot as plt
import numpy as np
import pandas as pd

indicator_h = "conf"
level_h     = 2
group_lvl_h = 1

# calculer le taux de notification et convertir en %
df_admin = compute_rep_rate(panel_df, level_h, indicator_h).assign(
    rr_pct=lambda d: d["reprate"] * 100
)

# attacher la colonne admin de regroupement
tree = (
    dhis2_df[[f"adm{level_h}", f"adm{group_lvl_h}"]]
    .drop_duplicates()
)
df_admin = (
    df_admin
    .merge(tree, on=f"adm{level_h}", how="left")
    .sort_values([f"adm{group_lvl_h}", f"adm{level_h}"])
)

# ordre adm : trié par groupe puis alphabétiquement au sein du groupe
adm_order = (
    df_admin[[f"adm{group_lvl_h}", f"adm{level_h}"]]
    .drop_duplicates()
    .sort_values([f"adm{group_lvl_h}", f"adm{level_h}"])
    [f"adm{level_h}"]
    .tolist()
)

yearmon_levels_h = sorted(df_admin["yearmon"].unique())
# un mois sur six sur l'axe x
x_breaks_h = yearmon_levels_h[::6]

# Zissou1 inversée
zissou1_colors = ["#3B9AB2", "#78B7C5", "#EBCC2A", "#E1AF00", "#F21A00"]
zissou1_r_cmap = mcolors.LinearSegmentedColormap.from_list(
    "Zissou1", zissou1_colors, N=100
).reversed()

# ordre axe y : premier indicateur en haut (R utilise rev(adm_order))
ind_order_h = list(reversed(adm_order))
pivot_h = (
    df_admin
    .pivot_table(
        index=f"adm{level_h}", columns="yearmon",
        values="rr_pct", aggfunc="mean"
    )
    .reindex(index=ind_order_h, columns=yearmon_levels_h)
)

fig, ax = plt.subplots(figsize=(12, 8))
mesh = ax.pcolormesh(
    np.arange(len(yearmon_levels_h) + 1),
    np.arange(len(ind_order_h) + 1),
    pivot_h.values,
    cmap=zissou1_r_cmap,
    vmin=0,
    vmax=100,
    linewidth=0.5,
    edgecolors="white",
    antialiased=False,
)
ax.set_aspect("auto")

xtick_pos_h = [yearmon_levels_h.index(ym) + 0.5 for ym in x_breaks_h]
ax.set_xticks(xtick_pos_h)
ax.set_xticklabels(x_breaks_h, rotation=75, ha="right", fontsize=8)

ax.set_yticks(np.arange(len(ind_order_h)) + 0.5)
ax.set_yticklabels(ind_order_h, fontsize=7)

ax.set_xlabel("")
ax.set_ylabel("District", fontsize=9)
ax.set_title(
    f"Taux de notification mensuel {indicator_h} par adm {level_h}",
    fontsize=12, pad=10,
)
ax.grid(False)

cbar = fig.colorbar(
    mesh, ax=ax, orientation="horizontal",
    fraction=0.03, pad=0.22, aspect=40,
)
cbar.set_label("Taux de notification (%)", fontsize=12, fontweight="bold")
cbar.ax.tick_params(labelsize=8)

plt.tight_layout()
import matplotlib.colors as mcolors
import matplotlib.pyplot as plt
import numpy as np

indicator_l   = "test"
level_l       = 3
target_adm2_l = "WESTERN RURAL"

df_line = compute_rep_rate(panel_df, level_l, indicator_l)

# attacher adm2 pour filtrer
tree_l = (
    dhis2_df[["adm2", f"adm{level_l}"]]
    .drop_duplicates()
)
df_line = (
    df_line
    .merge(tree_l, on=f"adm{level_l}", how="left")
    .loc[lambda d: d["adm2"] == target_adm2_l]
)

yearmon_levels_l = sorted(df_line["yearmon"].unique())
x_breaks_l = yearmon_levels_l[::4]

n_adm_l = df_line[f"adm{level_l}"].nunique()

# Zissou1 échantillonnée à n_adm_l positions
zissou1_lc = mcolors.LinearSegmentedColormap.from_list(
    "Zissou1", ["#3B9AB2", "#78B7C5", "#EBCC2A", "#E1AF00", "#F21A00"], N=100
)
line_colors_l = [
    zissou1_lc(i / max(n_adm_l - 1, 1)) for i in range(n_adm_l)
]

adm3_list = sorted(df_line[f"adm{level_l}"].unique())

fig, ax = plt.subplots(figsize=(12, 6))

for idx, adm_val in enumerate(adm3_list):
    sub = (
        df_line.loc[df_line[f"adm{level_l}"] == adm_val]
        .sort_values("yearmon")
    )
    ax.plot(
        sub["yearmon"],
        sub["reprate"],
        linewidth=0.75,
        color=line_colors_l[idx],
        label=adm_val,
    )

ax.set_xticks(
    [yearmon_levels_l.index(ym) for ym in x_breaks_l]
)
ax.set_xticklabels(x_breaks_l, rotation=75, ha="right", fontsize=8)
ax.yaxis.set_major_formatter(mticker.PercentFormatter(xmax=1, decimals=0))
ax.set_ylim(0, 1)
ax.set_xlabel("")
ax.set_ylabel("Taux de notification", fontsize=9)
ax.set_title(
    f"Taux de notification mensuel {indicator_l}, {target_adm2_l}",
    fontsize=12, pad=10,
)
ax.tick_params(labelsize=8)
ax.legend(fontsize=7, loc="lower center",
          ncol=min(n_adm_l, 6), bbox_to_anchor=(0.5, -0.40))
ax.grid(axis="y", linewidth=0.4, alpha=0.5)
ax.grid(axis="x", visible=False)
for spine in ["top", "right"]:
    ax.spines[spine].set_visible(False)
plt.tight_layout()
import math
from pathlib import Path

import geopandas as gpd
import matplotlib.colors as mcolors
import matplotlib.pyplot as plt
import numpy as np
import pandas as pd
from pyprojroot import here

indicator_m = "conf"

# charger l'objet spatial adm2 traité (GeoJSON associé au .rds)
adm2_gdf = gpd.read_file(Path(here(
    "01_data/1.1_foundational/1.1a_admin_boundaries/processed"
    "/sle_spatial_adm2_2021.geojson"
)))
if adm2_gdf.crs is None:
    adm2_gdf = adm2_gdf.set_crs("EPSG:4326")

# taux de notification annuel moyen par adm2
df_map = (
    compute_rep_rate(panel_df, 2, indicator_m)
    .assign(year=lambda d: d["yearmon"].str[:4])
    .groupby(["adm2", "year"], as_index=False)
    .agg(rr_pct=("reprate", lambda x: x.mean() * 100))
)

# fill_min : plancher du plus petit taux annuel observé
fill_min = math.floor(df_map["rr_pct"].min())

# attacher aux polygones (jointure gauche pour chaque polygone-année)
years_m = sorted(df_map["year"].unique())
df_map_gdf = adm2_gdf.merge(df_map, on="adm2", how="left")

# Zissou1 inversée pour le taux de notification (taux élevé = bleu = bon)
zissou1_colors = ["#3B9AB2", "#78B7C5", "#EBCC2A", "#E1AF00", "#F21A00"]
zissou1_r_cmap = mcolors.LinearSegmentedColormap.from_list(
    "Zissou1", zissou1_colors, N=100
).reversed()
norm = plt.Normalize(vmin=fill_min, vmax=100)

# disposition en 3 lignes (correspond à ggplot2 facet_wrap(nrow=3))
n_years = len(years_m)
n_cols_m = math.ceil(n_years / 3)
n_rows_m = 3

fig, axes = plt.subplots(
    n_rows_m, n_cols_m,
    figsize=(12, 8),
    squeeze=False,
)

for idx, yr in enumerate(years_m):
    row = idx // n_cols_m
    col = idx % n_cols_m
    ax = axes[row][col]

    sub = df_map_gdf.loc[df_map_gdf["year"] == yr]

    # fond gris pour les polygones manquants
    adm2_gdf.plot(ax=ax, color="grey90", edgecolor="white", linewidth=0.2)

    sub.plot(
        column="rr_pct",
        ax=ax,
        cmap=zissou1_r_cmap,
        norm=norm,
        edgecolor="white",
        linewidth=0.2,
        missing_kwds={"color": "#EBEBEB"},
    )

    ax.set_title(yr, fontsize=9, fontweight="bold")
    ax.set_axis_off()

# masquer les axes inutilisés
for idx in range(n_years, n_rows_m * n_cols_m):
    axes[idx // n_cols_m][idx % n_cols_m].set_visible(False)

# barre de couleurs horizontale en bas (partagée)
sm = plt.cm.ScalarMappable(cmap=zissou1_r_cmap, norm=norm)
sm.set_array([])
cbar = fig.colorbar(
    sm, ax=axes, orientation="horizontal",
    fraction=0.02, pad=0.02, aspect=50,
    shrink=0.5,
)
cbar.set_label("Taux de notification (%)", fontsize=12, fontweight="bold")
cbar.ax.tick_params(labelsize=8)

fig.suptitle(
    f"Taux de notification annuel {indicator_m} par adm2",
    fontsize=12, y=1.01,
)
plt.tight_layout()